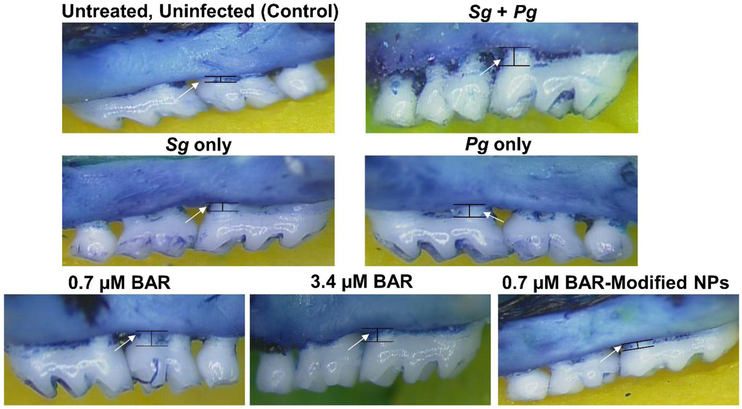
Figure 2.
Representative images from different in vivo treatment groups (n=8 per group), of the area between the cemento-enamel junction (CEJ) and alveolar bone crest (ABC), measured to determine bone loss. Images were taken using a dissecting microscope fitted with a video imaging marker measurement system (Sony model VIA −170K; Fryer) at a total magnification of 40x.

