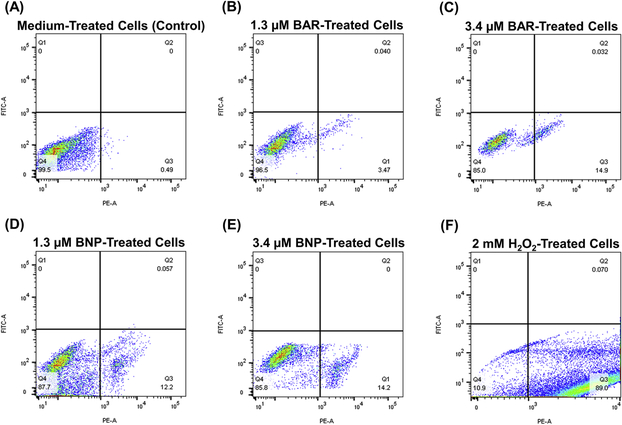
Figure 7.
TIGK cells were treated with (A) medium alone, (B) 1.3 μM free BAR, (C) 3.4 μM free BAR, (D) 1.3 μM BNPs, (E) 3.4 μM BNPs and (F) 2 mM hydrogen peroxide. The FITC versus phycoerythrin (PE) fluorescence dot plots show the live (bottom left quadrant) and apoptotic cell (bottom right quadrant) cell populations. Data represent the mean ± standard deviation (n=3), 10,000 counts.

