
Figure 6.
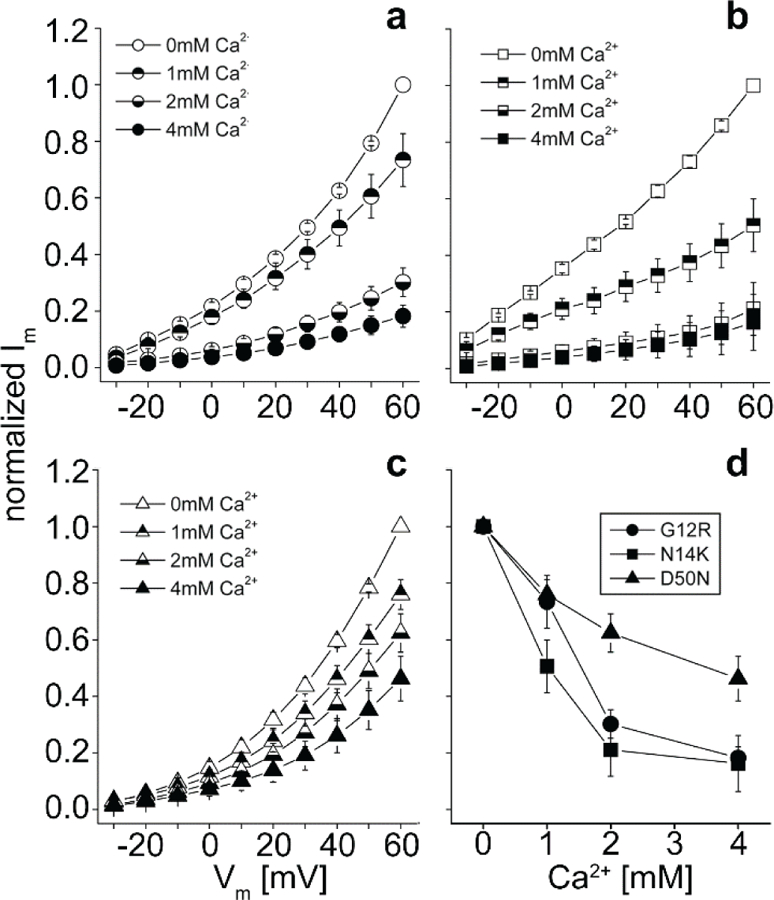
Current-voltage relationships of cells recorded in MB with 0, 1, 2, or 4 mM Ca2+ (open, top closed, bottom closed, and completely closed, respectively). Only cells that expressed hemichannels were recorded. (a-c) Cells were clamped at −40mV and then tested with pulses from −30mV to +60mV via +10mV steps. G12R (○), N14K (□), and D50N (△) mutations caused hemichannel activity that increased at positive potentials. The magnitude of hemichannel current was reduced at all potentials as the extracellular concentration of Ca2+ increased. (d) Currents for each mutation were normalized for steady-state maximal values at each concentration and plotted against the concentration of extracellular Ca2+. There was a distinct difference in the degree and rate of current reduction induced by Ca2+.