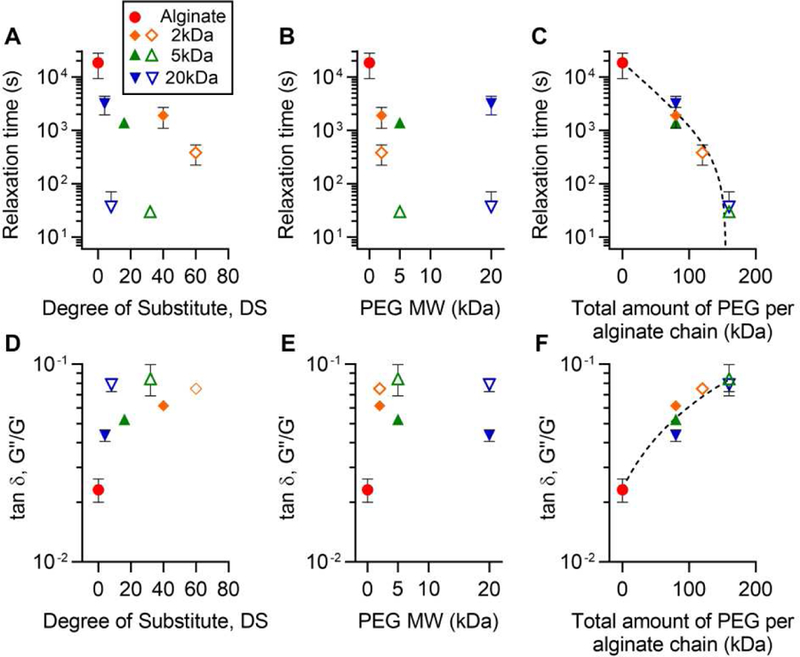
Figure 3. Total mass amount of PEG in alginate-PEG gels determines hydrogel stress relaxation and loss tangent.

Display of relaxation time as a function of A, degree of substitution (DS), B, length, and C, the total amount of PEG. In C, relaxation time was fitted as y = 18904 e−0.025x − 402. Display of loss tangent, a measure of viscosity defined as the ratio of loss modulus (G’’) to storage modulus (G’), as a function of A, DS, B, length, and C, the total amount of PEG. In F, loss tangent was fitted as y = 3.75 × 10⁻⁴x + 0.0236.
