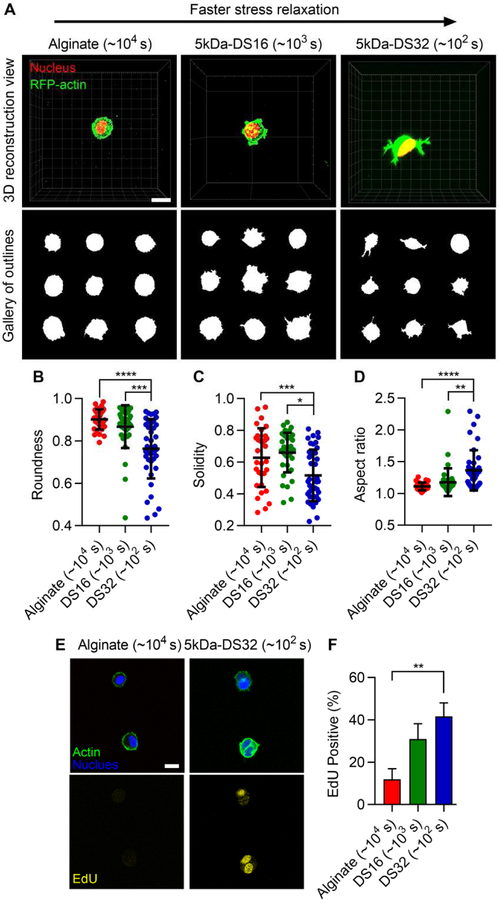
Figure 5. Faster stress relaxation in alginate-PEG hydrogels promotes cell spreading and cell-cycle progression.
A, Morphologies of 3T3 fibroblasts encapsulated within alginate gels without, and with 5k Da PEG of DS 16 and 32. Red and green represent nucleus and actin. Quantification of B, roundness, C, solidity, and D, aspect ratio of cells in the alginate-PEG gels. E, Fluorescent images of cells for EdU staining. F, Quantification of EdU positive cells in alginate-PEG gels. One-way ANOVA and Tukey’s comparisons; *, **, ***, and **** indicate p < 0.05, p < 0.01, p< 0,001, and p < 0.0001, respectively. Scale bars are 10 µm.

