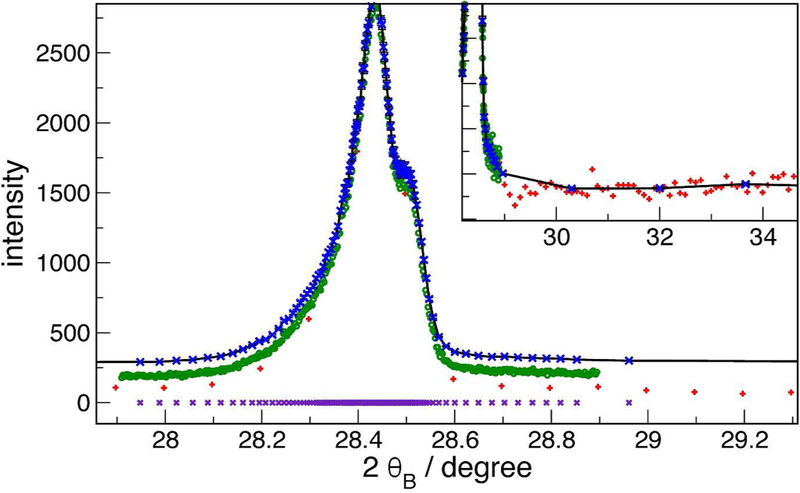
Figure 1:

Example of rebinned data from CuKα diffraction from silicon powder. Green circles, high-resolution on-peak scan. Red ’+’, low-resolution survey scan. Blue crosses, rebinned combination showing variable bin spacing with ε = 2 %. The data sets are offset vertically for clarity. Violet crosses at the bottom are the rebinned set projected down to the x axis, to make it easier to see the adaptive point spacing. Inset shows a vertically expanded region where the count rate is very low.
