Figure 3:

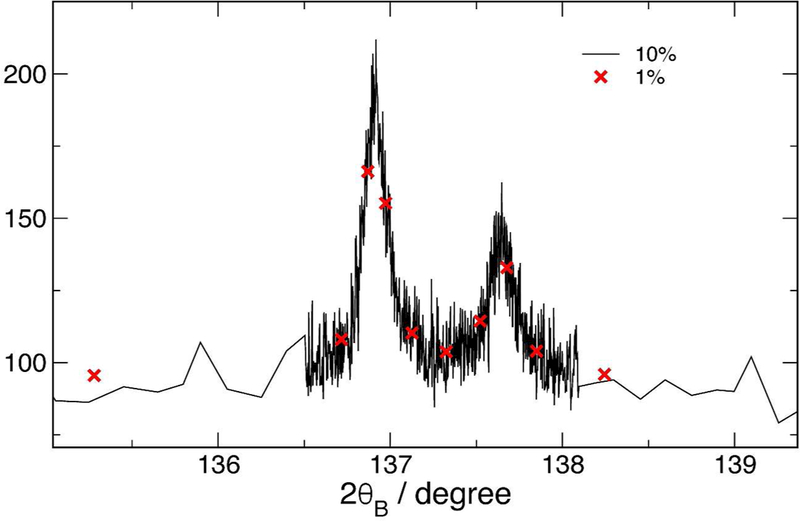
Comparison of minimally aggregated data to highly aggregated data used for fits in table 1. This is a detail of a weak region of the entire angular range from 20 to 140 degrees. The data labels are the tolerance used in the rebinning.

Comparison of minimally aggregated data to highly aggregated data used for fits in table 1. This is a detail of a weak region of the entire angular range from 20 to 140 degrees. The data labels are the tolerance used in the rebinning.