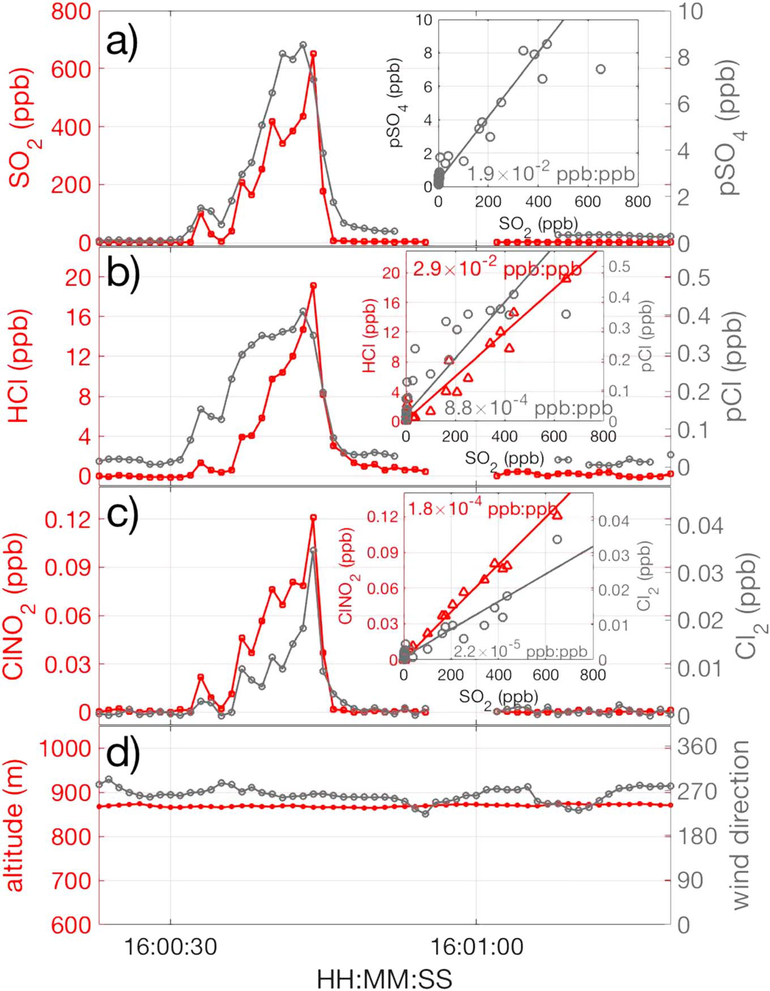
Figure 1.
Mixing ratios of (a) SO2, pSO4; (b) HCl, pCl; (c) ClNO2, and Cl2 during research flight 11 on 9 March around 4 p.m. local time (polluted plume encounter number 44 out of 50; see Table S1). The slopes with respect to SO2 shown in the insets of (a), (b), and (c) define the corresponding emission ratios with respect to SO2. Altitude and wind direction during this polluted air mass encounter are shown in (d).

