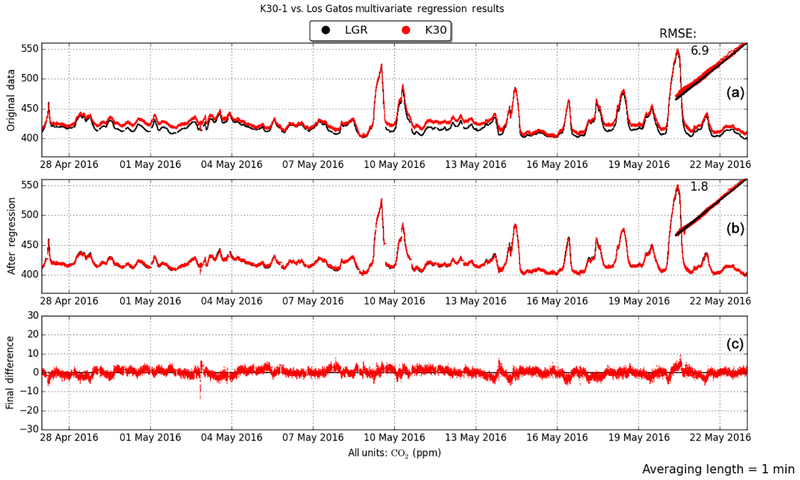
Figure 8.
A continuous time series of 1 min averages as well as scatter plots for K30–1 compared to the LGR for the multivariate regression described in Sect. 5.2. (a) The original data, (b) final time series after correction and the (c) difference plot between the corrected K30 dataset and the original LGR dataset. The root mean square error (RMSE) of the K30 data compared to the LGR before and after the regression is annotated to the upper left of the scatter plot.

