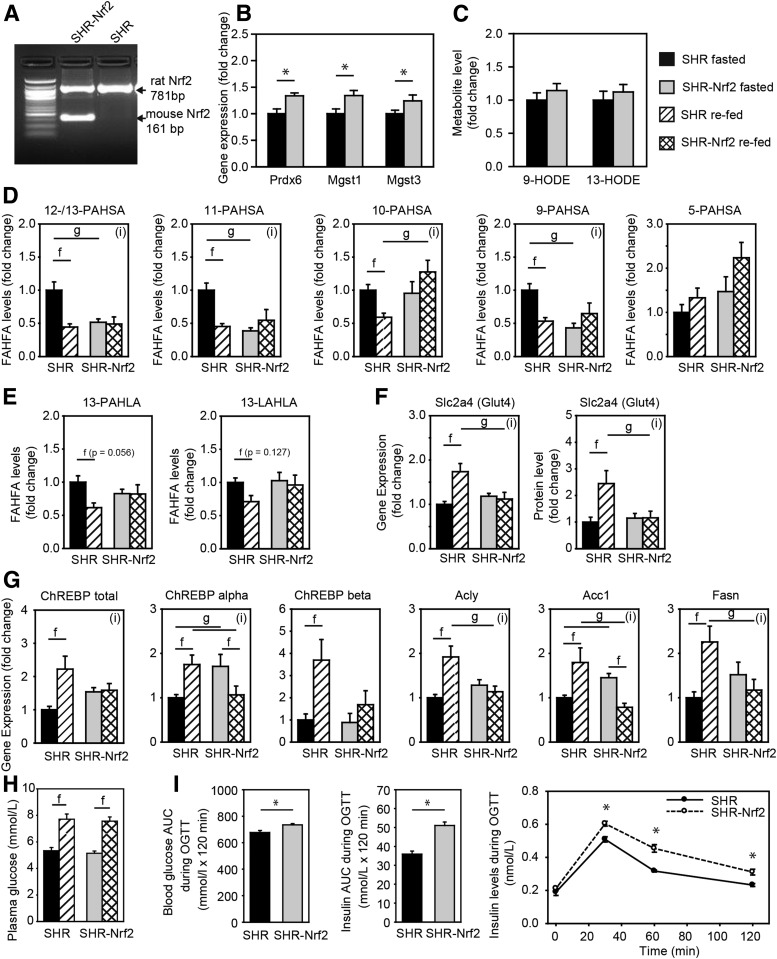
Figure 5.
Effect of Nrf2 overexpression on DNL in WAT. SHR wild-type and SHR-Nrf2 transgenic rats were fasted for 24 h and either sacrificed or refed chow for 6 h. A: Transgenic expression of murine Nrf2 in WAT. B: Expression of positional candidate genes. C: Levels of 9- and 13-HODE (also known as hydroxylinoleic acid [HLA]) in WAT. D: Levels of PAHSA regioisomers. E: Levels of HLA-derived FAHFAs. F: Gene expression and protein levels (MS label-free quantitation) of Glut4 (Slc2a4). G: Gene expression of DNL pathway. Acly, ATP citrate lyase; Acc1, acetyl-CoA carboxylase; Fasn, fatty acid synthase. H: Plasma glucose levels. Data are expressed as means ± SEM, n = 7, fold change over SHR fasted group. I: OGTT. Blood glycemia and insulin levels during the OGTT. AUC, area under the curve. Data are expressed as means ± SEM, n = 10–11. *Student t test: significantly different at P < 0.05. Two-way ANOVA/Holm-Sidak test: (i), statistically significant interaction between genotype and nutritional state at P < 0.05; f, significantly different nutritional state P < 0.05; g, significantly different genotype P < 0.05.

