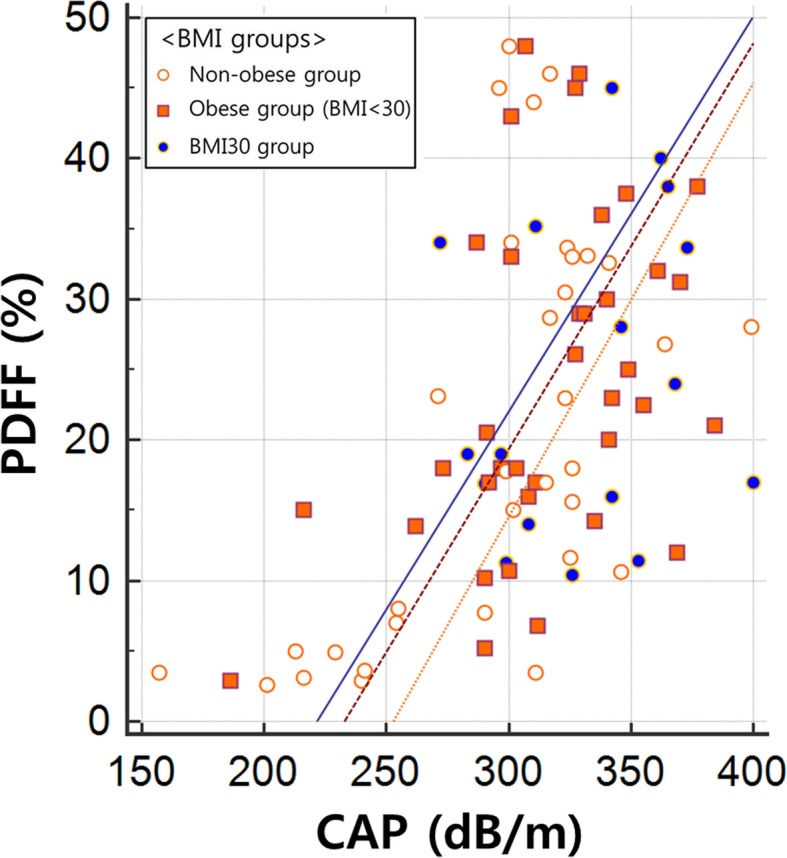
Fig. 2.

A scatter plot of hepatic steatosis between PDFF and CAP. CAP values were positively correlated with PDFF in all patients (r = 0.486; 95% confidence interval [CI]: 0.306, 0.633; p < 0.001). In subgroups according to body mass index (BMI), the r was 0.585 (95% CI: 0.302, 0.773; p < 0.001) in the non-obese group (BMI < 95th percentile) and 0.354 (95% CI: 0.093, 0.570; p = 0.009) in the obese group (BMI ≥ 95th percentile). However, PDFF and CAP values were not correlated in the BMI30 (BMI > 30 kg/m2) group
