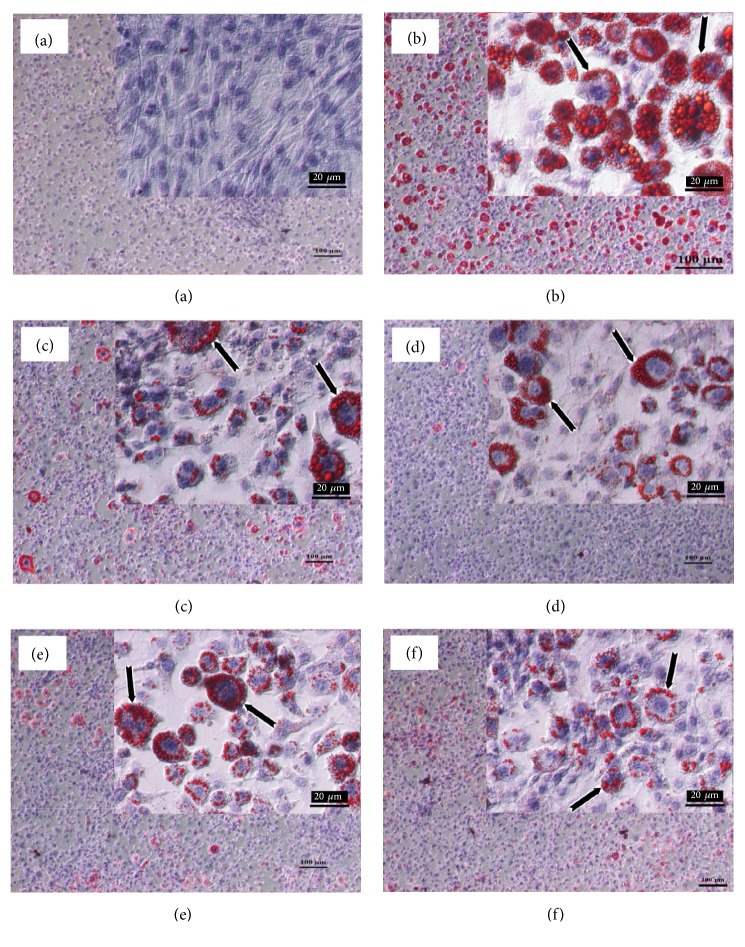
Figure 2.
Results of Oil Red O and hematoxylin staining for intracellular lipid for six sample groups: (a) preadipocytes (nondifferentiated cells); (b) untreated adipocytes, (c) simvastatin at 1.67 μg mL−1; (d) CSE at 10 μg mL−1; (e) GIE at 500 μg mL−1; (f) combination of CSE at 10 μg mL−1 plus GIE at 500 μg mL−1 (original magnification x 100, scale bar: 100 μm; inset: x 600, scale bar: 20 μm.)

