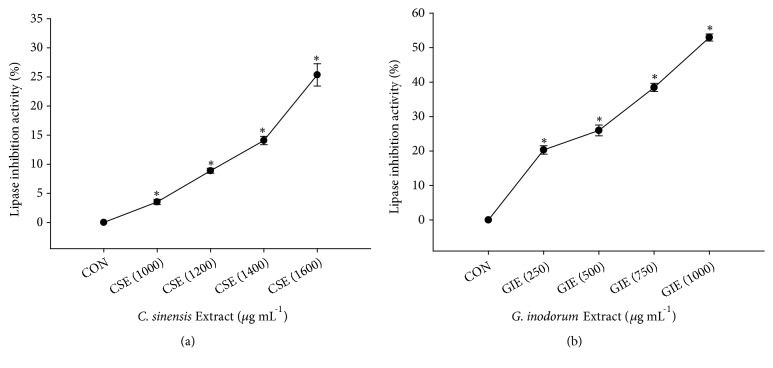
Figure 4.
Inhibitory effects of CSE (a) and GIE (b) at various concentrations on pancreatic lipase activity (%). CON = control; CSE (1000) = CSE at 1000 μg mL−1; GIE (250) = GIE at 250 μg mL−1. Results are expressed as mean ± SEM values (three replicates). ∗ p < 0.05 indicates result significantly different from the control.

