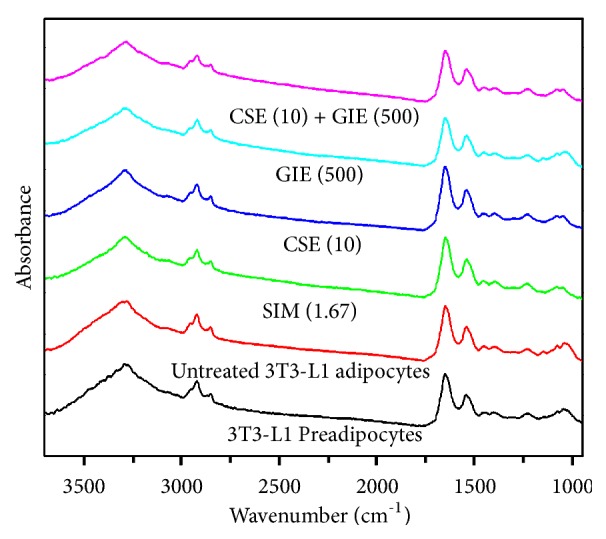
Figure 5.

Representative original FTIR spectra (3000–950 cm−1) obtained from 3T3-L1 cells at day 10 after differentiation. 3T3-L1 preadipocytes (n = 41); untreated 3T3-L1 adipocytes (n = 39); SIM (1.67) = simvastatin at 1.67 μg mL−1 (n = 49); CSE (10) = CSE at 10 μg mL−1 (n = 98); GIE (500) = GIE at 500 μg mL−1 (n = 76); CSE (10) + GIE (500) = CSE at 10 μg mL−1 plus GIE at 500 μg mL−1 (n = 97).
