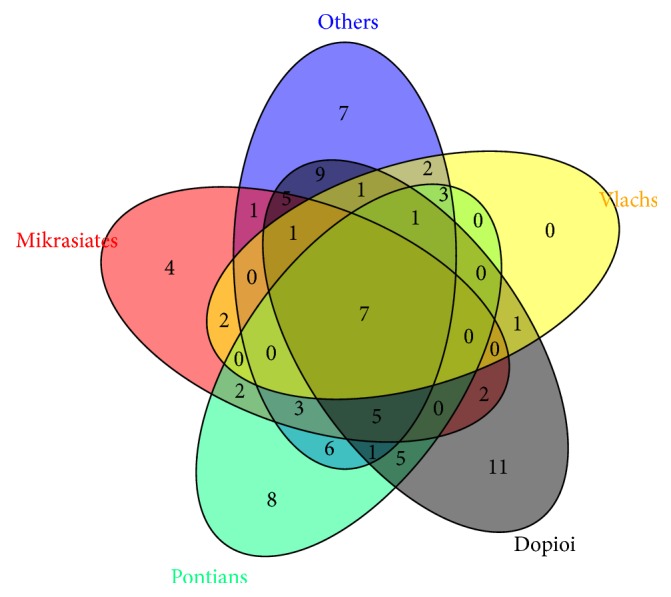
Figure 4.

Venn diagram representing an overlap of Traditional Ethnobotanical Knowledge of the 5 population groups. Numbers are the species in common for each combination of overlapping (including nonoverlapping subsets, i.e., species reported by a single population group).
