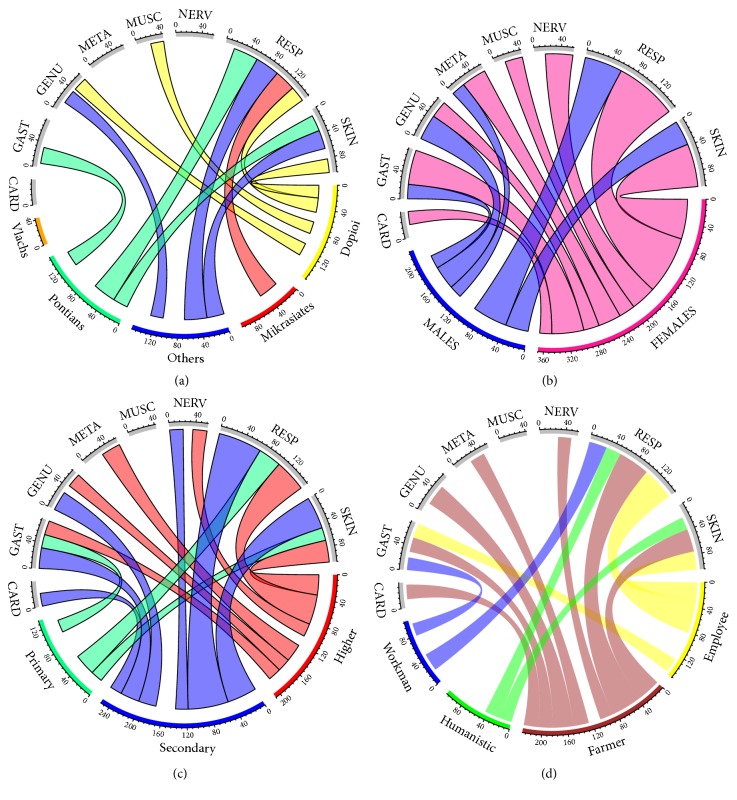
Figure 5.
Circular plots showing the relationships among referred disease categories and the informants grouped on the basis of different social factors: (a) origin; (b) gender; (c) education; (d) job. Color bands summarize main relationships (> 20% of the total information) between each disease category and population groups. Numbers below the external segments in the graphs represent the total numbers of citations for each disease category and population group (e.g., in Figure 5(a), 40 citations were overall reported for plants used as a remedy for muscular-skeletal diseases, whereas a total of 132 citations were provided by Dopioi).

