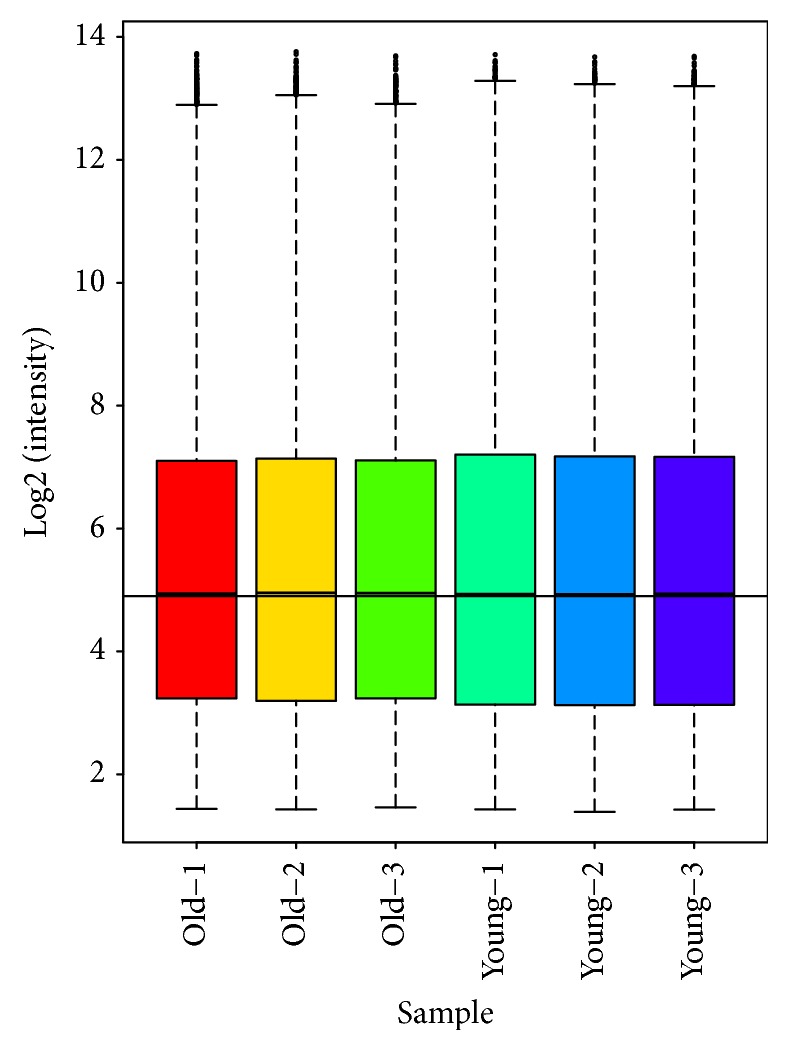
Figure 1.

Box and whisker plot (Box plot). We performed the comparison of gene expression with a total of six samples from young (n=3) and old (n=3) mouse ovarian secondary follicles by using Affymetrix 3' IVT Expression Arrays (Mouse Genome 430 2.0 array) at Bioassay Laboratory of CapitalBio Corporation. Robust multiarray average (RMA) algorithm was used to eliminate the variation in the arrays from noisy data. Box plot was constructed to illustrate the distribution of normalized probe hybridization signal intensities (log ratios) for all six arrays (young and old mouse ovarian secondary follicles). The probe distribution by 0-100% quantiles as whiskers, the 25-75% quantiles as different color boxes, and the 50% quantile as horizontal line within the box indicated a similar range of signal intensities and confirmed perfect hybridization.
