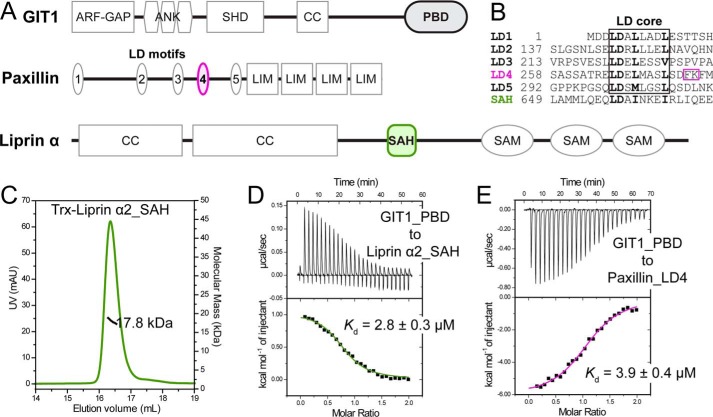
Figure 1.
Biochemical characterization of the GIT1/liprin-α and GIT1/paxillin interactions. A, cartoon diagrams of domain organizations for GIT1, paxillin, and liprin-α. The color-coding of the regions is applied throughout the entire paper except as otherwise indicated. B, sequence alignment of five LD motifs in paxillin and the SAH sequence in liprin-α2 showing the consensus sequence in the LD core region. The unique FK sequence found in the LD4 motif is highlighted by a purple box. C, the molecular weight of liprin-α2_SAH was measured using analytical gel filtration chromatography–coupled multi-angle static light scattering. The theoretical molecular mass of monomeric Trx-tagged liprin-α2_SAH is 18.2 kDa. D and E, ITC-based measurement of the bindings of GIT1_PBD to liprin-α2_SAH (D) and paxillin_LD4 (E), respectively. The thermodynamic parameters of the ITC titrations as shown in this and following figures are summarized in Table S1.

