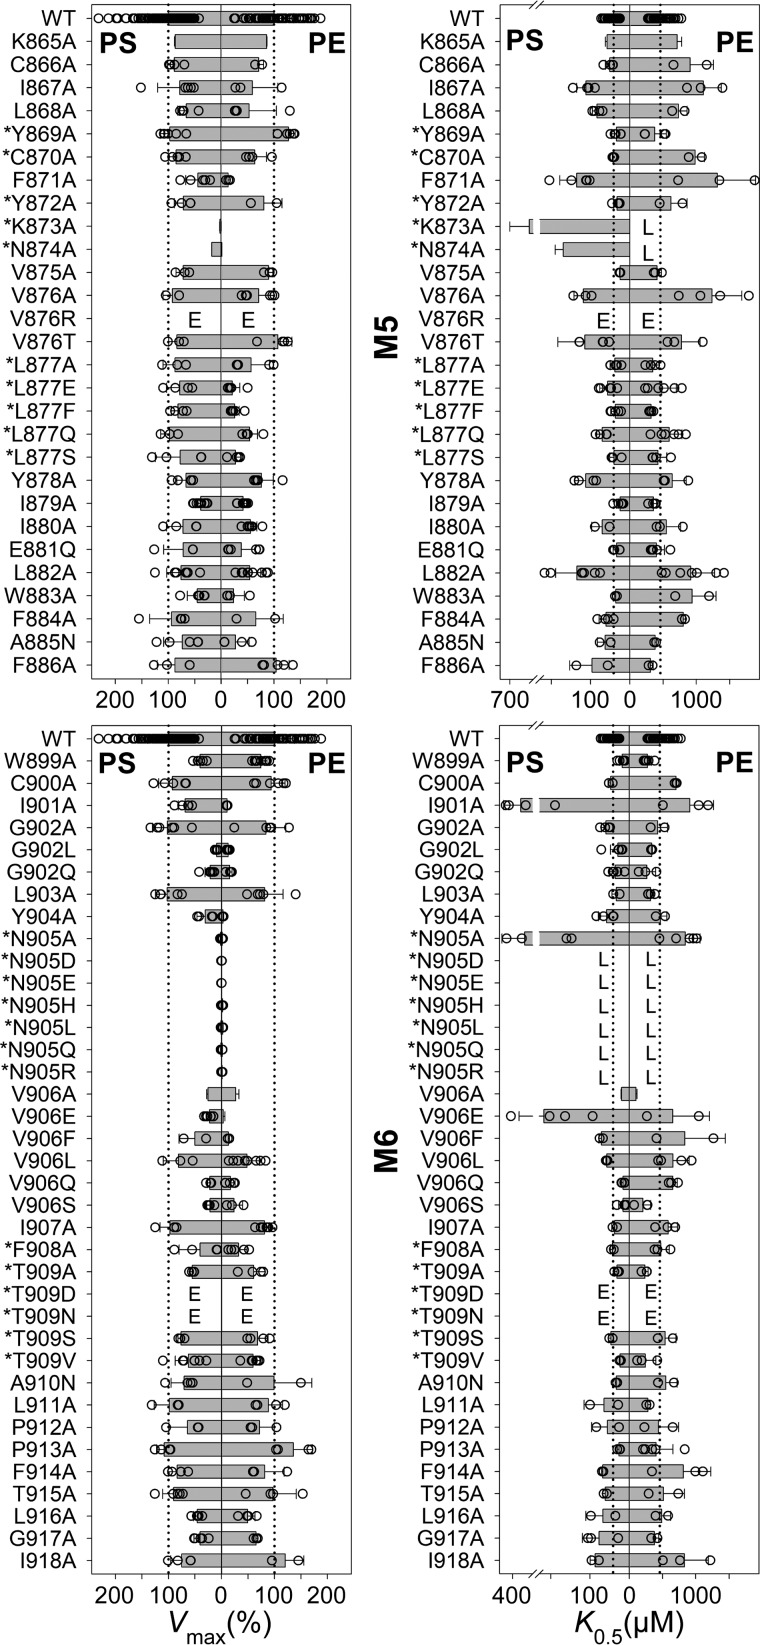
Figure 3.
Vmax and apparent affinity (K0.5) for PS or PE of M5 and M6 mutants. Residues at positions corresponding to ion-binding residues in the ion pumps are indicated by an asterisk. The ATPase activity per mg of purified flippase protein was determined and analyzed in the presence of varying concentrations of PS or PE as described under “Experimental procedures.” Examples of the determined concentration dependences and the fitted lines are shown in Fig. 4. The apparent lipid affinities are expressed as the concentration giving half-maximum activation (K0.5). Vmax generally refers to the plateau value obtained at the highest lipid concentration (1000 μm PS or 2000 μm PE). For a few mutants showing inhibition at high lipid concentration, Vmax was taken as the peak value. The Vmax is shown in percentage of the WT Vmax, which was 111 ± 43 μmol/min/mg for PS and 42 ± 16 μmol/min/mg for PE (average ± S.D.). All numbers on which this figure is based are found in Table 1. All the individual data points collected are shown as circles, and the columns show the average values. The error bars indicate the S.D. For further information on statistics, see Table 1. E indicates that the expression level of the mutant was too low for reliable determination of the ATPase activity. L indicates that although the mutant was well expressed, the ATPase activity was too low for reliable determination of substrate affinity.

