Figure 3.
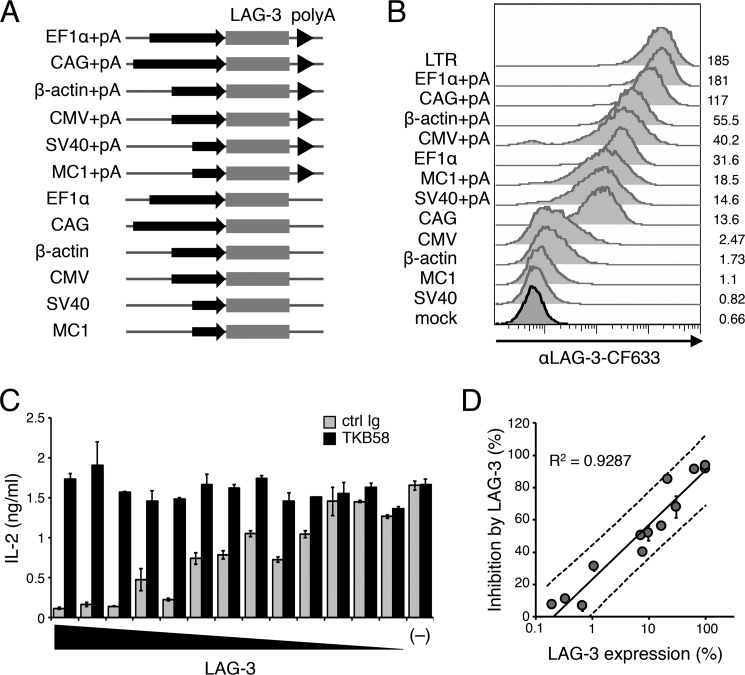
Correlation between the amount of LAG-3 and its inhibitory effect. A, schematic of retroviral expression vectors. Mouse LAG-3 cDNA was overexpressed in DO11.10 T cells using the indicated promoters with or without a poly(A) signal. B, DO11.10 T cells with various expression levels of LAG-3. The expression levels of LAG-3 were evaluated by flow cytometry using an anti-LAG-3 Ab (TKB58). MFI is indicated. C, LAG-3–dependent inhibition of IL-2 production in DO11.10 T cells with various LAG-3 expression levels. DO11.10 T cells overexpressing LAG-3 under the indicated promoter with or without a poly(A) signal were stimulated with pOVA-pulsed (1 μm) IIA1.6 cells in the presence of anti-LAG-3–blocking Ab (TKB58) or its isotype control (ctrl Ig). The concentration of IL-2 in the culture supernatant was determined by ELISA. D, the correlation between the percentage of LAG-3–dependent inhibition and the expression level of LAG-3. The amount of LAG-3 was calculated relative to that of DO11.10 T cells expressing LAG-3 under the LTR promoter. The solid line represents the regression line, and dashed lines represent 95% prediction intervals. The correlation coefficient is shown. Data are the mean ± S.D. of technical duplicates in one experiment. Data are representative of more than three independent experiments.

