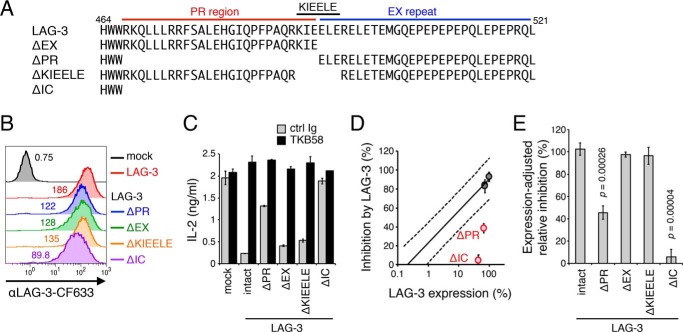
Figure 4.
Requirement of the PR region for the inhibitory function of LAG-3. A, amino acid sequences of the IC region of LAG-3 and its deletion mutants. The PR, KIEELE sequence, and EX repeat are indicated by red, black, and blue lines, respectively. Numbers denote the position of the amino acid from the translation initiation site. B, expression levels of LAG-3 mutants in DO11.10 T cells. DO11.10 T cells expressing LAG-3 and its indicated mutants were stained with TKB58 and analyzed by flow cytometry. C–E, defective inhibition of IL-2 production from DO11.10 T cells by LAG-3 lacking its PR and IC region. DO11.10 T cells expressing LAG-3 and its mutants were stimulated with pOVA-pulsed (1 μm) IIA1.6 cells in the presence of anti-LAG-3–blocking Ab (TKB58) or its isotype control (ctrl Ig). C, the concentration of IL-2 in the culture supernatant was determined by ELISA. The relative expression level and the inhibitory effect of LAG-3 mutants are plotted in the standard plot shown in Fig. 3D. D, LAG-3 mutants with weaker function are highlighted in red. E, the inhibitory effect relative to intact LAG-3 with the same expression level is shown for the indicated LAG-3 mutants. Data are the mean ± S.D. of technical duplicates in one representative experiment from three independent experiments (C) or the mean ± S.D. of three independent experiments (D and E). p values comparing the expression-adjusted relative inhibition of the indicated LAG-3 mutants with that of intact LAG-3 are shown (Student's t test, E).

