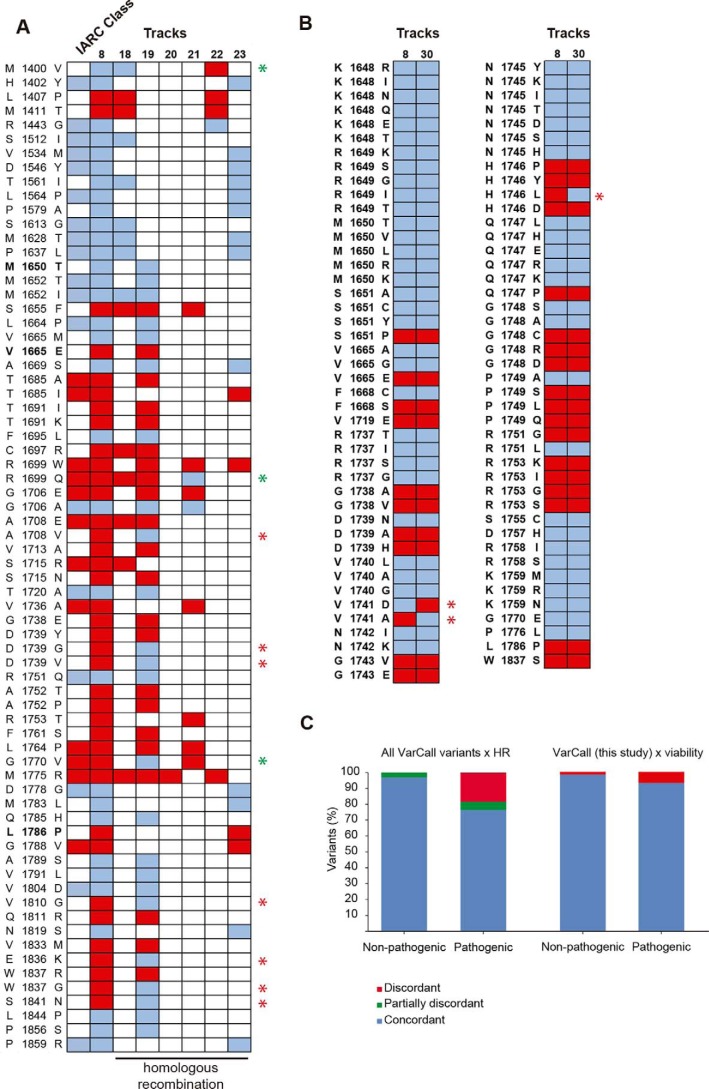
Figure 6.
High concordance between VarCall classification and other functional assays. A, diagram showing classification of all missense variants in aa 1315–1863 as defective (red squares) or not (blue squares according to VarCall (Track 8) or to functional assays based on homologous recombination (Tracks 18–23 in Table S6). First row depicts IARC Class using the multifactorial model (Table S4) with red squares (Classes 4–5) and blue squares (Classes 1–2). Discordant results between VarCall and any HR assay are indicated by a red star. Green stars indicate discordant from any assay but in agreement with another HR assay. Variants are in bold font. B, diagram showing classification of variants tested in this study as defective (red squares) or not (blue squares) according to VarCall (Track 8) or to a saturation mutagenesis study (Track 30; Findlay et al. (28)) based on cell viability. Discordant results are indicated by a red star. C, fraction of missense variants with disagreements between assays.

