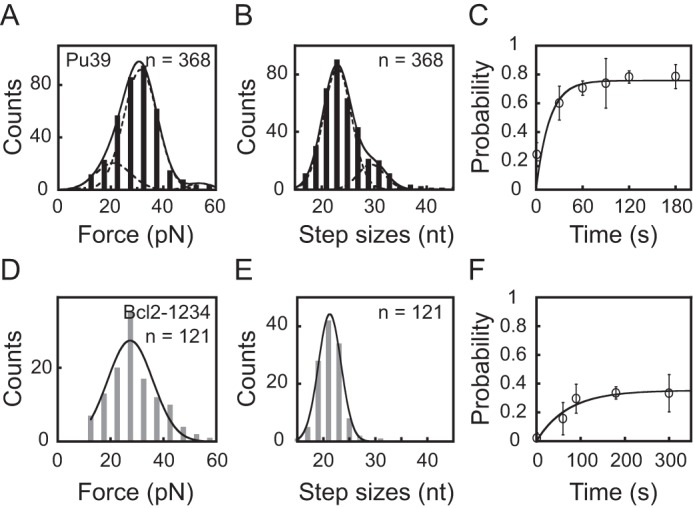
Figure 4.

A, unfolding force histogram of the Pu39 sequence in 100 mm KCl. Data were fitted by a three-peak Gaussian equation (solid line) with peak values of 21 ± 7, 31 ± 6, and 54 ± 5 pN. B, unfolding step size histogram of the Pu39 sequence. Data were fitted by a two-peak Gaussian equation (solid line) with peak values of 23 ± 3 and 30 ± 2 nt. C, the time evolution of the folding probability pfold(t) of the Pu39 sequence. D, unfolding force histogram of Bcl2-1234 G4. Data were fitted by a single-peak Gaussian equation (solid line) with a peak value of 27 ± 9 pN. E, unfolding step size histogram of Bcl2-1234 G4. Data were fitted by a single-peak Gaussian equation (solid line) with a peak value of 21 ± 2 nt. F, the time evolution of the folding probability pfold(t) of the Bcl2-1234 sequence.
