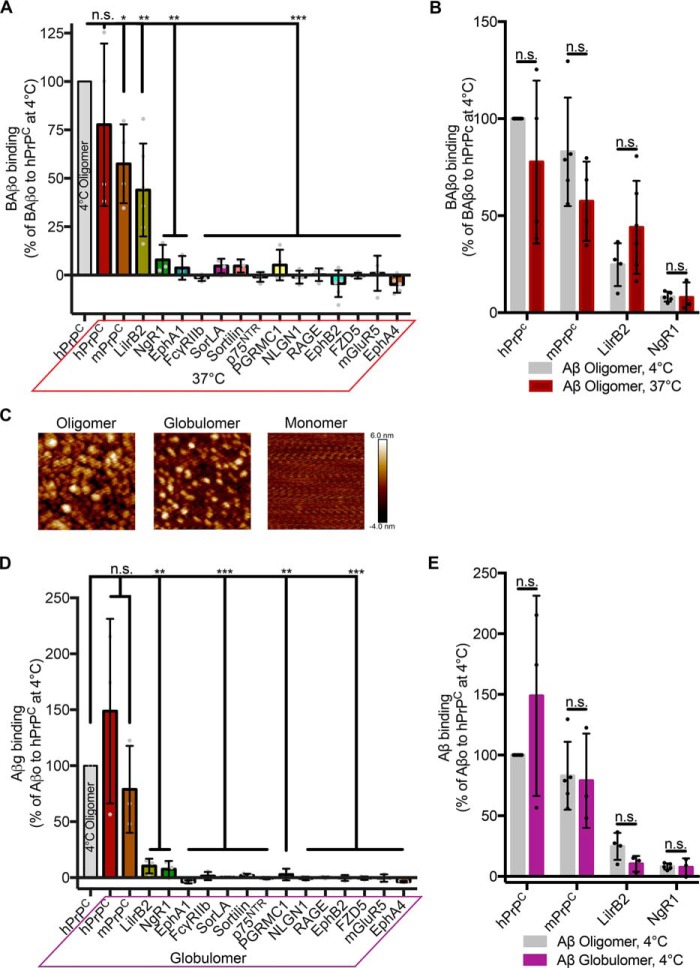
Figure 4.
Neither temperature nor oligomer preparation changes the binding profile of candidate receptors. A, quantification of 1 μm biotin Aβo binding to cells expressing candidate receptors at 37 °C. Binding is normalized to that of hPrPC at 4 °C. One-sided t test was used, comparing with an expected value of 100 (% hPrPC binding at 4 °C). n = 3–6 experiments. B, comparison of the capacity of a candidate receptor to bind biotin Aβo at 4 °C (Fig. 2B) versus 37 °C. Shown are multiple t tests with Holm–Sidak correction for multiple comparisons. C, atomic force microscopy images showing differences in Aβ generated by different preparations. Images are 200 × 200 nm. D, Myc-normalized binding of 1 μm Aβ prepared using the globulomer protocol. Data are expressed relative to oligomerized Aβ binding to hPrPC. One-sided t test was used, comparing with an expected value of 100 (% hPrPC binding); n = 3 experiments, 2 for PGRMC1. E, comparison of positive receptors' binding of oligomer (Fig. 2B) and globulomer Aβ. Shown are multiple t tests with Holm–Sidak correction for multiple comparisons. Individual data points indicate different experiments. Error bars, S.D. n.s., not significant; *, p < 0.05; **, p < 0.01; ***, p < 0.001.

