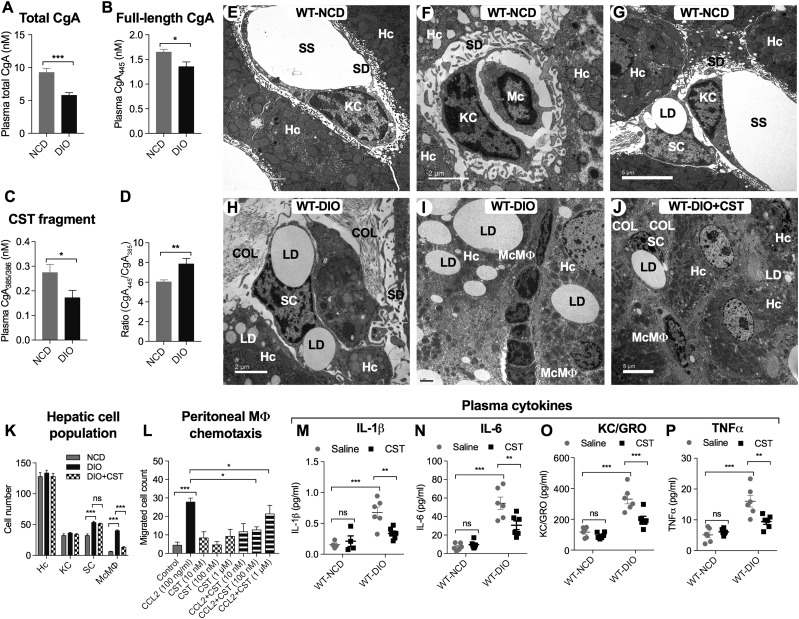
Figure 1.
A–D: Plasma CgA and its fragments (n = 12–24). Total CgA (full-length plus processed) (A), full-length CgA (B), CST fragment (C), and ratio of full-length CgA and CST fragment (D). E–J: TEM photograph of liver sections (n = 4). E: WT NCD liver showing hepatocytes (Hc), KCs, and associated subcellular structures. F: WT NCD liver showing hepatocytes, monocyte (Mc), and associated subcellular structures. G: WT NCD liver showing hepatocytes, KCs, and SCs. H: WT DIO liver showing SCs. I: WT DIO liver showing hepatocytes, infiltrated McMΦs in the interhepatocyte space, and associated subcellular structures. J: WT DIO liver showing CST-induced inhibition of infiltration of McMΦs and associated subcellular structures. Scale bars: E, G, and J = 5 μm; F, H, and I = 2 μm. K: Morphometric analyses of parenchymal and nonparenchymal cells. Hepatocyte and KC numbers were comparable in WT NCD, WT DIO, and WT DIO+CST-treated groups. SC and McMΦ numbers were increased in WT DIO mice. Note that CST treatment of DIO mice caused significant decreases in McMΦs but exerted no effect on SCs. L: Chemotaxis of peritoneal MΦs (n = 5). CCL2-induced peritoneal MΦ was significantly inhibited by CST (10 and 100 nmol/L doses). M–P: Plasma cytokines (n = 5–8). CST inhibited inflammatory plasma cytokines. COL, collagen; LD, lipid droplet; SD, space of Disse or perisinusoidal space; SS, sinusoidal space. *P < 0.05; **P < 0.01; ***P < 0.001.

