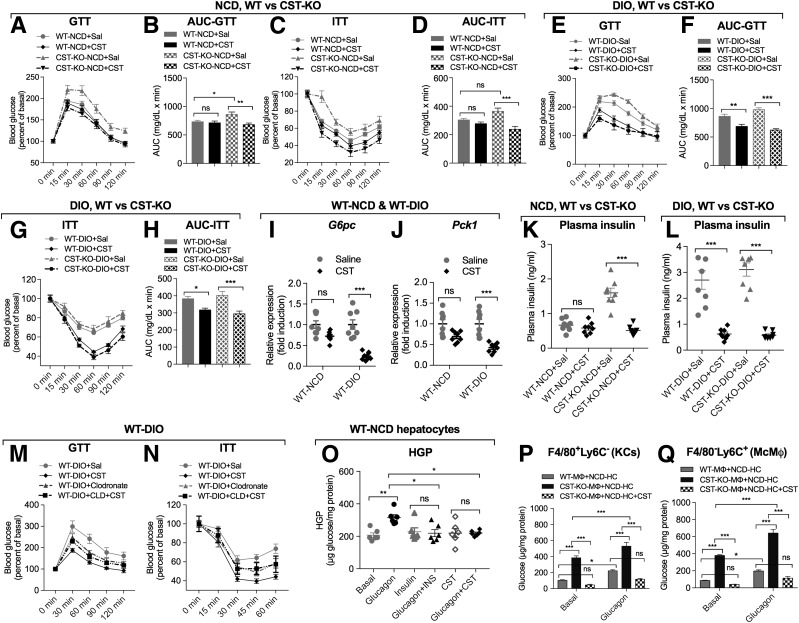
Figure 4.
A–D: CST improves glucose tolerance and insulin sensitivity in CST-KO NCD mice. Glucose tolerance test (GTT) (n = 10) on mice fasting for 10 h (A) and the corresponding area under the curve (AUC) (B). Data were analyzed by three-way ANOVA. Time, P < 0.001; treatment, P < 0.01; genotype, P < 0.001; time × treatment, ns; time × genotype, P < 0.05; treatment × genotype: P < 0.001; time × treatment × genotype: ns. Insulin tolerance test (ITT) (n = 8) on mice fasting for 10 h (C) and the corresponding area under the curve (D). Data were analyzed by three-way ANOVA. Time, P < 0.001; treatment, ns; genotype, P < 0.001; time × treatment, ns; time × genotype, P < 0.01; treatment × genotype, P < 0.001; time × treatment × genotype, P < 0.05. E–H: CST improves glucose tolerance and insulin sensitivity in both WT DIO and CST-KO DIO mice (n = 9); phenotypes of NCD-fed CST-KO mice. Glucose tolerance test (n = 8) on mice fasting for 10 h (E) the corresponding area under the curve (F). Data were analyzed by three-way ANOVA. Time, P < 0.001; treatment, P < 0.05; genotype, P < 0.001; time × treatment, ns; time × genotype, P < 0.001; treatment × genotype, P < 0.001; time × treatment × genotype, P < 0.01. Insulin tolerance test (n = 8) on mice fasting for 10 h (G) and the corresponding area under the curve (H). Data were analyzed by three-way ANOVA. Time, P < 0.001; treatment, ns; genotype, P < 0.001; time × treatment, ns; time × genotype, P < 0.01; treatment × genotype, P < 0.001; time × treatment × genotype, ns. I and J: CST decreases expression of gluconeogenic genes in DIO liver (after 10 h fasting) (n = 8). Expression of G6pc gene (I) and Pck1 gene (J). K and L: CST decreases plasma insulin in CST-KO NCD, WT DIO, and CST-KO DIO mice (after 10 h fasting). Plasma insulin (n = 8) in WT NCD and CST-KO NCD mice (K) as well as in WT DIO and CST-KO DIO mice (L). M and N: Depletion of MΦs abolishes CST-induced improvement in glucose tolerance and insulin sensitivity in WT DIO mice (n = 6). Glucose tolerance test (M) and insulin tolerance test (N). O: HGP, n = 6. CST decreases glucagon-induced HGP in WT-NCD hepatocytes. P and Q: HGP by MΦs from NCD-fed CST-KO mice (n = 4). F4/80+ MΦs (P) and Ly6C+ MΦs (Q). Note the dramatic increase in basal glucose production in hepatocytes (HC) cocultured with both F4/80+ and Ly6C+ cells from CST-KO mice. Glucagon caused an even further increase in glucose production in both cell types. Increased glucose production was completely inhibited when hepatocytes were cocultured with CST-treated MΦs and incubated with glucagon. INS, insulin; Sal, saline. *P < 0.05; **P < 0.01; ***P < 0.001.

