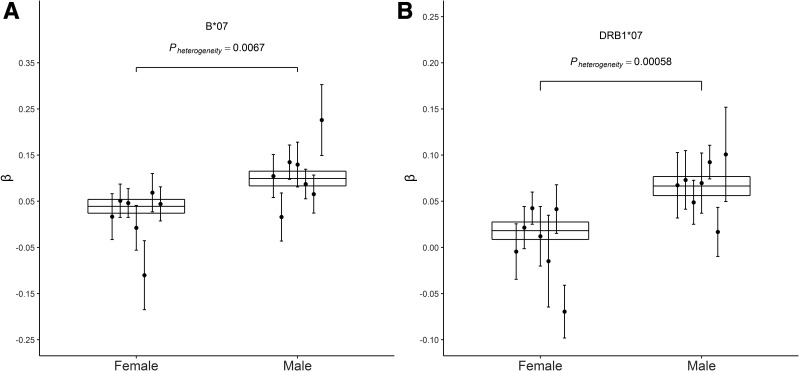
Figure 4.
HLA alleles that associate with BMI in a sex-dependent manner. Each of the seven geographic study-specific association estimates (β; represented by a circle) and SE (represented by a vertical line) are shown in males and females separately for B*07 (A) and DRB1*07 (B). The meta-analysis mean and SE (represented by the horizontal lines) for all seven studies was calculated using the GWAMA software. Pheterogeneity is the P value for heterogeneity between male and female.

