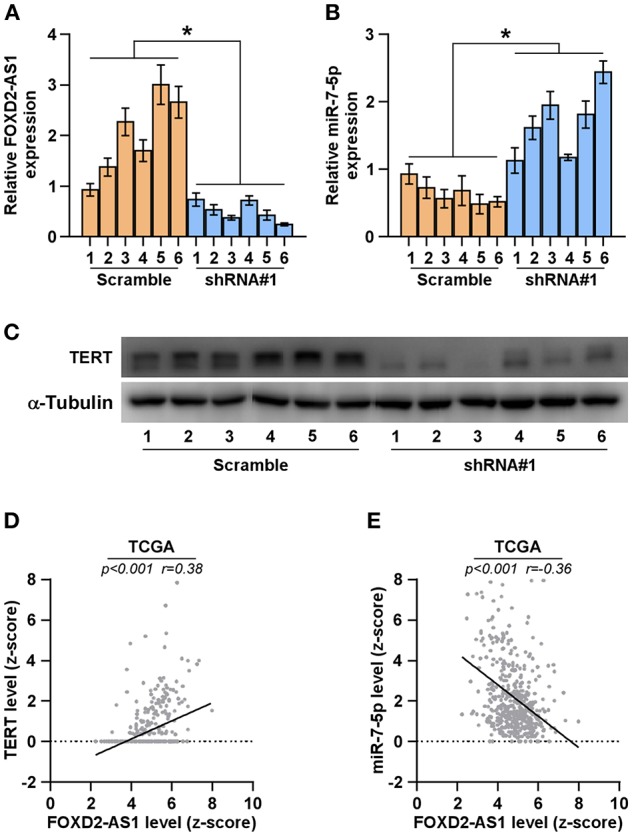
Figure 7.

Correlation of FOXD2-AS1 with miR-7-5p and TERT (A,B) FOXD2-AS1 and miR-7-5p expression levels in the tumors from the scramble and FOXD2-AS1 shRNA#1 group of mice were determined by real-time PCR analysis. FOXD2-AS1 and miR-7-5p expression levels were normalized to that FOXD2-AS1 expression of sample one. *P < 0.05. (C) TERT expression levels in the tumors from the scramble and FOXD2-AS1 shRNA#1 groups of mice were examined by Western blot analysis. α-tubulin was used as the loading controls. (D,E) Correlation between FOXD2-AS1, miR-7-5p and TERT in clinical thyroid cancer samples from TCGA.
