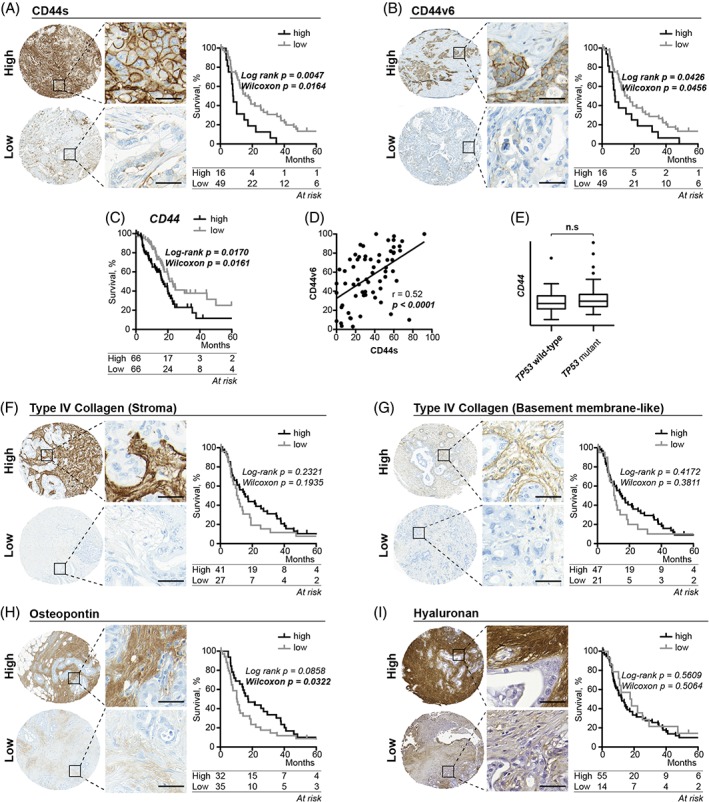
Figure 1.

High versus low expression and associated Kaplan–Meier estimates for the primary tumour expression of (A,B) CD44 receptors, (F–G) type IV collagen, (H) osteopontin and (I) hyaluronan. Tissue microarray cores are 1 mm in diameter. Scale bar = 50 μm in highlighted areas. *Compared using Wilcoxon–Breslow estimates. (C) Kaplan–Meier survival estimates for patients with high versus low expression of CD44 mRNA transcripts. (D) Plot showing the correlation between CD44s and CD44v6 expression in primary tumours. (E) Box plots of CD44 mRNA transcripts in TP53 wild type and TP53 mutant primary tumours.
