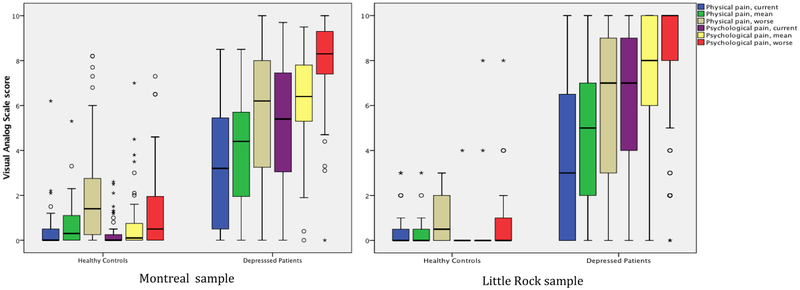
Graph 1.
Distribution of PPP-VAS scores for each dimension according to depression status in Montreal (left) and in Little Rock (right).
Footnotes: Black line inside box = median of distribution; Upper and lower limits of a box = 75th and 25th percentiles of the distribution (the box therefore represents 50% of the sample); Vertical lines = range between minimal and maximal values within 1.5 times the length of a box; Stars and circles = extreme minimal and maximal values beyond 1.5 (circles) and 3 (stars) times the length of the box.

