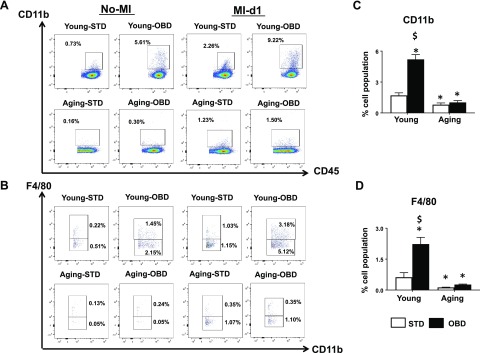
Figure 5.
Aging diminished splenic leukocyte kinetics independent of OBD post-MI. A) Representative flow cytometry dot plots depicting CD45+/CD11b+ population in spleen isolated from young and aging mice fed STD and OBD for 2 mo pre- and post-MI. B) Representative flow cytometry dot plots showing lower CD11b+/F4/80+ population in spleen isolated from young and aging mice fed STD and OBD for 2 mo pre- and post-MI. C) Bar graphs representing percentage of CD11b+ population in spleen at d 1 post-MI. D) Bar graphs representing percentage of F4/80+ population in spleen at d 1 post-MI. Values are mean ± sem (n = 3–5 mice/group/time point for flow cytometry analysis). *P < 0.05 vs. young-STD, $P < 0.05 STD vs. OBD.

