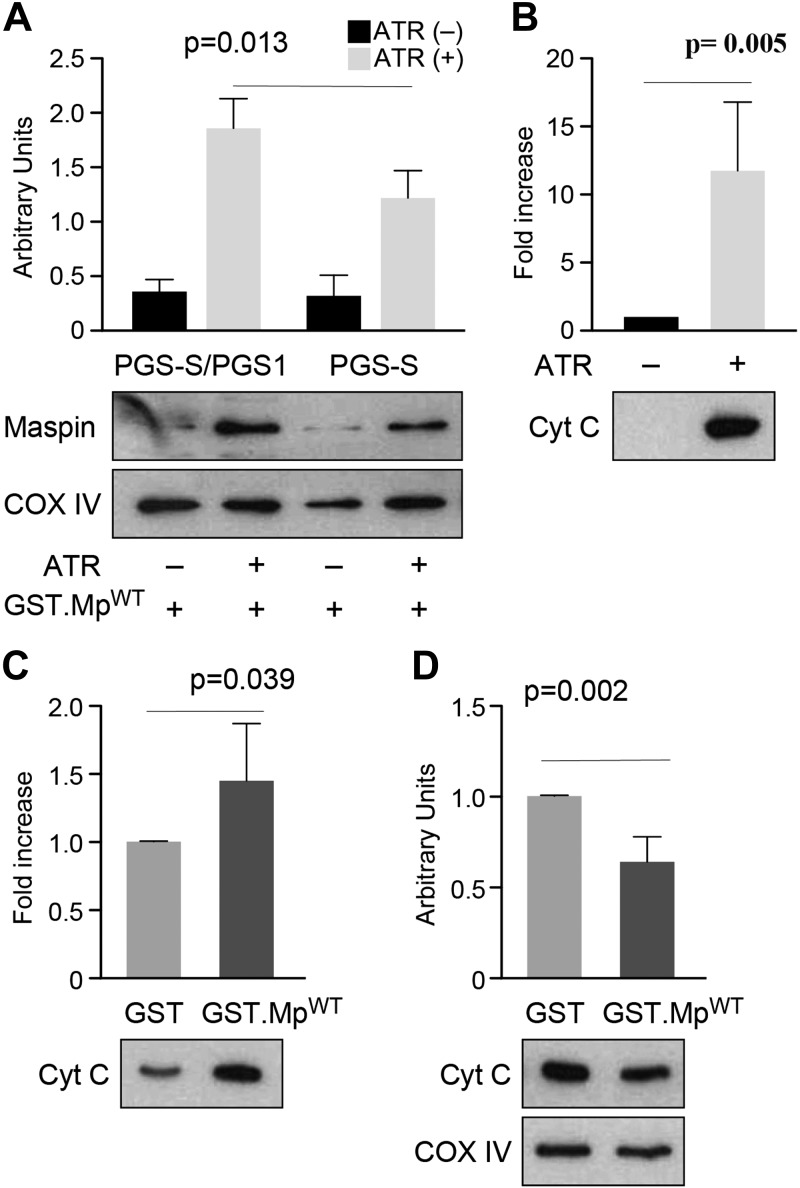
Figure 4.
Maspin binds CL in the mitochondria and displaces CL-bound cytochrome c (Cyt C). A) A plot comparing the amount of maspin retained in mitochondria isolated from PGS-S/cPGS1 and PGS-S cells; COX IV was used as a mitochondrial loading control. The data indicate that a reduction in cellular CL reduces the concentration of mitochondrial maspin. B) A plot comparing cytochrome c (from the intermitochondrial membrane space) released after ATR treatment of mitochondria isolated from mouse liver. The supernatants were concentrated in a MicroVac and loaded on SDS-PAGE to determine the relative concentration of cytochrome c. ATR treatment led to a large increase in cytochrome c. C) A plot of the amount of cytochrome c released from ATR-treated mitochondria incubated with GST.MpWT compared with GST. The supernatants were concentrated in a MicroVac and loaded on SDS-PAGE to determine the relative concentration of cytochrome c; GST was used as a negative control. D) A plot comparing IMM-bound cytochrome c in mitochondrial pellets after incubating organelles with either GST or GST.MpWT.

