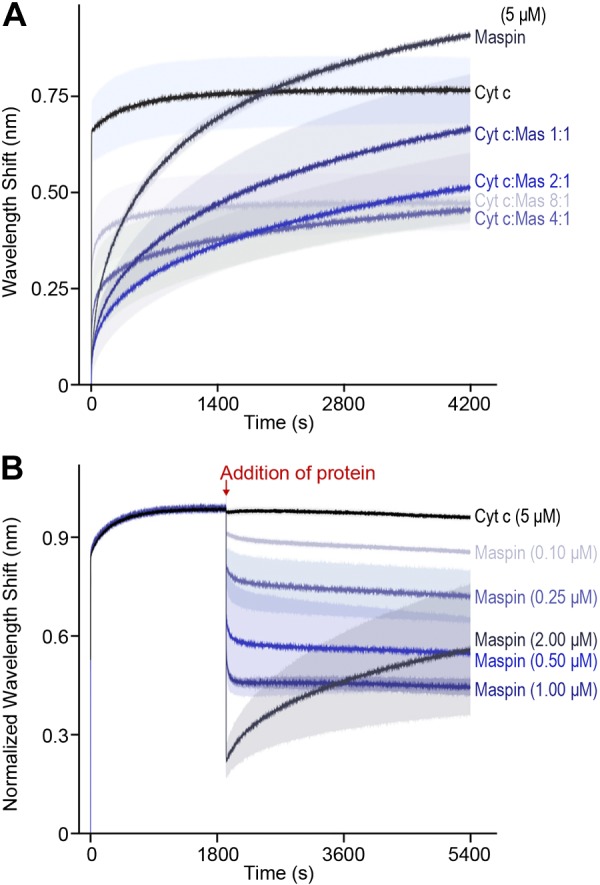
Figure 5.

Maspin (mas) occludes and displaces cytochrome c (Cyt c) from binding to PC and CL liposomes. A) To measure the competition of cytochrome c and maspin at membranes, we dipped APS-coated BLI biosensors containing adsorbed PC:CL liposomes (50:50 by molar concentration) into wells containing varying ratios of cytochrome c and maspin and a total protein concentration of 5 μM. We measured the competition of protein for the membrane surface for 4200 s. Cytochrome c and maspin (5 μM) are shown in black and dark blue, respectively. Decreasing concentrations of maspin (cytochrome c:maspin molar ratios of 1:1, 2:1, 4:1, and 8:1) are indicated by the color gradient (dark to light blue). Lines indicate the mean wavelength shift values (based on n = 3 measurements), and the shading indicates the the mean ± sd. B) To measure the displacement of cytochrome c by maspin, we equilibrated APS-coated BLI biosensors containing adsorbed PC:CL liposomes (50:50 by molar concentration) into wells containing cytochrome c (5 μM) for 2000 s, then dipped into wells containing 5 μM cytochrome and different concentrations of maspin. The black curve depicts data for cytochrome c (5 μM) dipped into a well containing 5 μM cytochrome c (as a control). Increasing concentrations of maspin are indicated by the color gradient (from light to dark blue). The competition of maspin and cytochrome c was monitored for 7000 s before returning tips to baseline wells to monitor dissociation (unpublished results). Lines indicate the means of 6 experiments, and shading indicates the mean ± sd (A, B).
