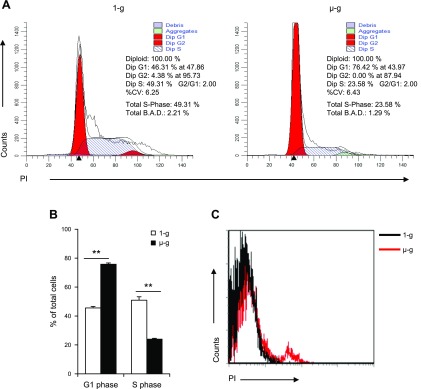
Figure 3.
Effects of simulated microgravity on cell cycle and apoptosis of HSPCs. A) Distribution of each phase of the cell cycle was evaluated in HSPCs after 12 d of culture under normal and simulated microgravity conditions. %CV (coefficient of variation) indicates the numerical dispersion degree. Total B.A.D (Background, Aggregates and Debris) indicates the amount of debris and aggregates found within the region between the first G1 and the last G2 peak. B) Ratio of G1 and S-phase murine HSPCs after 12 d of culture under normal and simulated microgravity conditions. C) Expression of propidium iodide (PI) in cultured HSPCs under simulated microgravity for 12 d. µ-g, simulated microgravity; 1-g, normal gravity. **P < 0.01.

