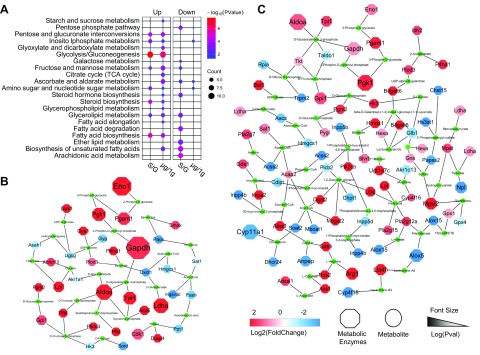
Figure 5.
Analysis and demonstration of microgravity-affected metabolism. A) Metabolic pathways obtained by KEGG enrichment are represented by bubble map. Color in the bubble chart indicates the significance of the enrichment category, and the size indicates the number of enriched genes. Up, up-regulated signal pathway; Down, down-regulated signal pathway; S/G, in S compared with G; μg/1g, in μg compared with 1g; Count, Number of genes enriched in this metabolic pathway. B) The relationship of metabolic enzymes and metabolites is visualized in the network based on spaceflight-affected DEGs. C) The relationship of simulated microgravity–affected metabolic enzymes and corresponding metabolites are displayed. µg, simulated microgravity; 1g, normal gravity; G, ground control for spaceflight; S, spaceflight; TCA, tricarboxylic acid cycle; Pval, P value of differential expression.

