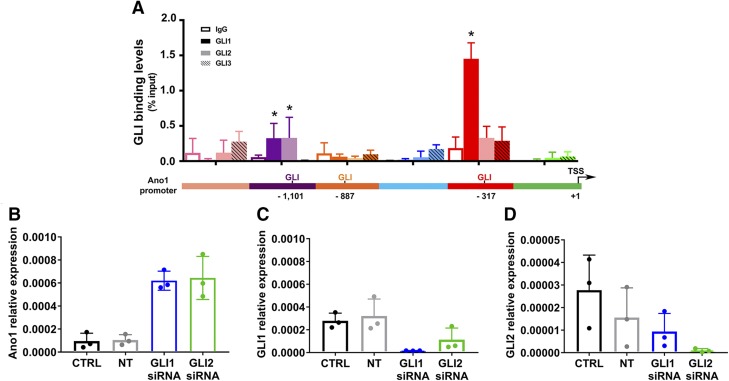
Figure 2.
Inhibition of endogenous Gli1 and Gli2 activity results in an increase in human ANO1 expression. A) ChIP–quantitative PCR showing Gli1 (solid, dark shade), Gli2 (solid, light shade), Gli3 (striped), or IgG (empty) relative enrichment over input on the human ANO1 promoter of HEK293 cells under basal conditions (n = 4). *P < 0.05, 2-way ANOVA with Dunnett’s multiple comparison test. B) Effect on ANO1 expression of siRNA knockdown of Gli1 or Gli2 in HEK293 cells. C) Expression of Gli1 after siRNA knockdown of Gli1 or Gli2. D) Expression of Gli2 after siRNA knockdown of Gli1 or Gli2. Ctrl, mock transfected control; NT, nontarget siRNA. Data (B–D) are plotted as expressions relative to housekeeping (hypoxanthine guanine phosphoribosyl transferase) and are represented as means ± sd (n = 3). *P < 0.05, 1-way ANOVA with Dunnet’s multiple comparison test.

