Figure 1.
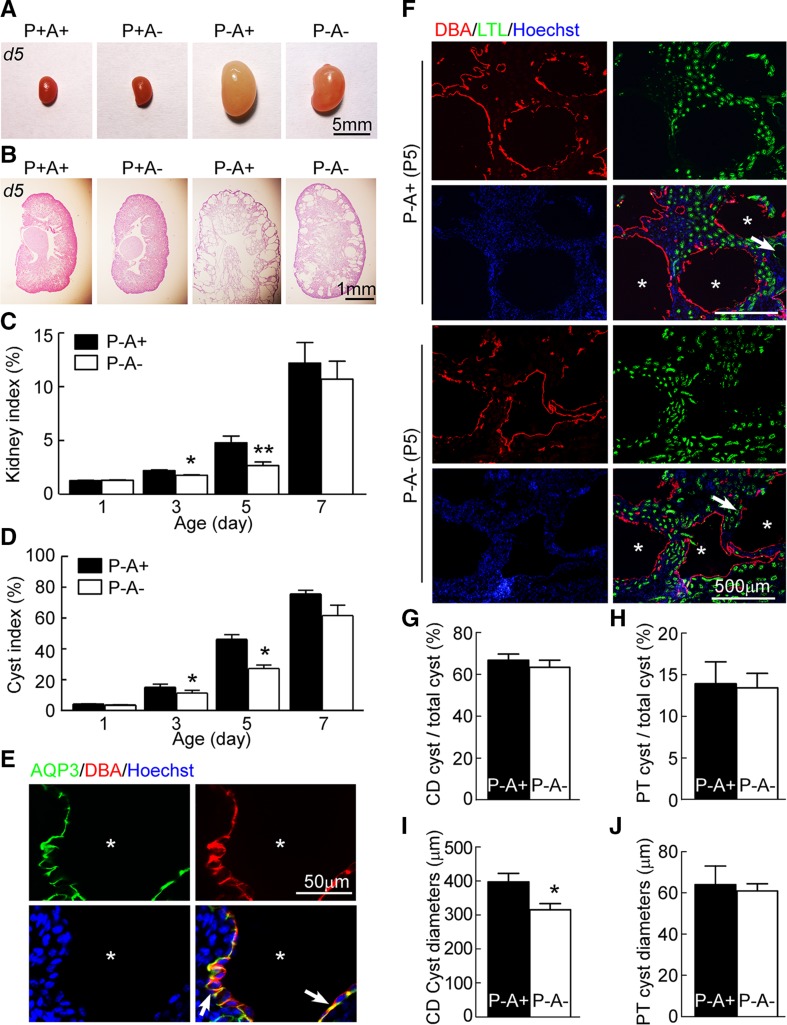
AQP3 deficiency reduces kidney index and cyst index in collecting ducts (CDs) in PKD mice. A) Representative images of kidneys at postnatal d 5 from mice with wild-type phenotype (P+A+, Pkd1flox/+; Ksp-Cre; AQP3+/− genotype), AQP3 knockout mice (P+A−, Pkd1flox/+; Ksp-Cre; AQP3−/− genotype), AQP3-expressing PKD mice (P-A+, Pkd1flox/flox; Ksp-Cre; AQP3+/− genotype), and AQP3-null PKD mice (P−A−, Pkd1flox/flox; Ksp-Cre; AQP3−/− genotype). B) H&E-stained sections. C) Kidney index (ratio of kidney to body weight). D) Cyst index. Means ± sem; P−A+, n = 6; P−A−, n = 6. *P < 0.05, **P < 0.01 compared with AQP3-expressing PKD mice [Student’s t test (C, D)]. E) AQP3 immunofluorescence in AQP3-expressing PKD (P−A+) kidneys at postnatal d 5. Sections were stained with AQP3 (green), DBA (red), and Hoechst 33342 (blue). Arrows indicate AQP3 localized at the basolateral membrane of cyst epithelial cells. Asterisks indicate cysts. F) DBA and LTL immunofluorescence of AQP3-expressing PKD (P−A+) and AQP3-null PKD (P−A−) kidneys at postnatal d 5. Asterisks indicate cysts derived from CD. The arrows indicate cysts derived from proximal tubule. G) Percentage of cysts derived from collecting duct. H) Percentage of cysts derived from proximal tubule (PT). I) Diameters of cysts (≥50 μm) derived from collecting duct. J) Diameters of cysts (≥50 μm) derived from PT. Means ± sem; n = 6. *P < 0.05 compared with AQP3-expressing PKD mice [Student’s t test (G–J)].

