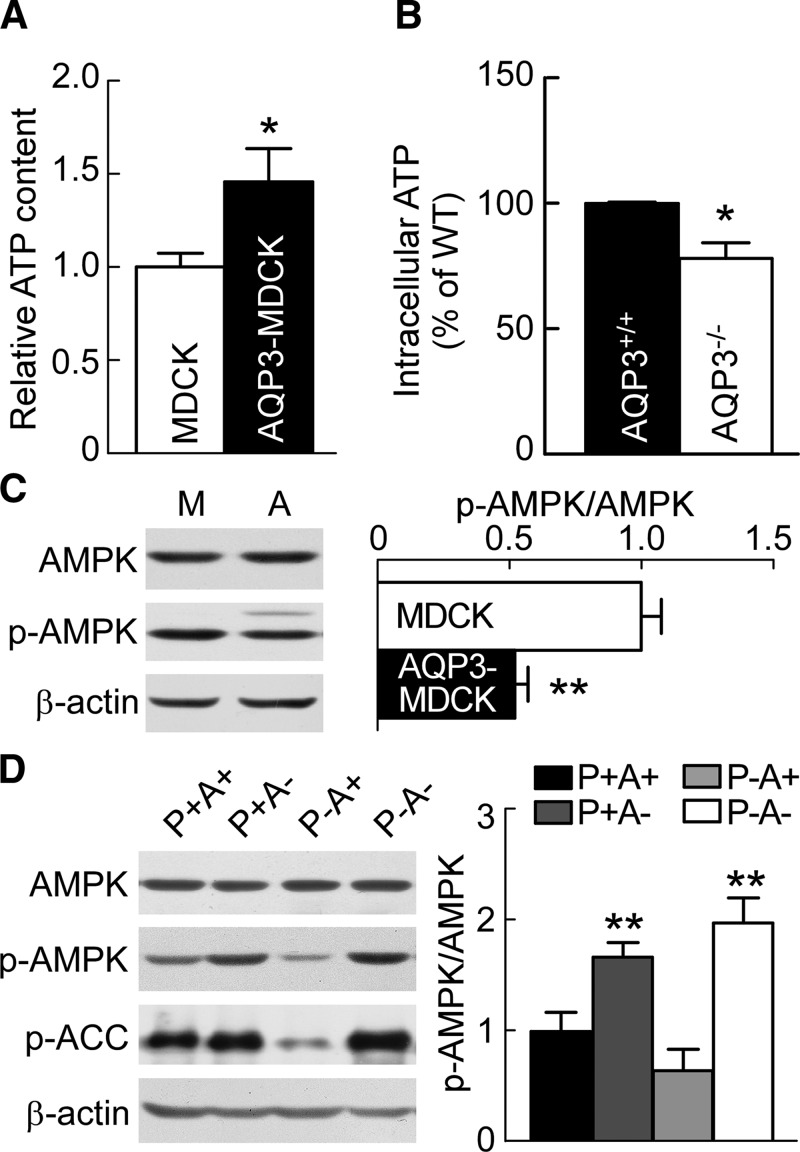
Figure 5.
AQP3 increases cellular ATP and reduces AMPK phosphorylation. A) Intracellular ATP in MDCK and AQP3-MDCK cells. Means ± sem, n = 6. *P < 0.05 vs. MDCK cells (Student’s t test). B) Intracellular ATP in AQP3+/+ and AQP3−/− mouse kidney. WT, wild type. Means ± sem, n = 6. *P < 0.05 vs. AQP3+/+ mice (Student’s t test). C) Western blot (left) of lysates of MDCK and AQP3-MDCK cells analyzed with AMPK, p-AMPK, and β-actin antibodies. Bar graph (right) shows the ratios of p-AMPK:AMPK. M, MDCK cells; A, AQP3-MDCK cells. Means ± sem, n = 6. **P < 0.01 vs. MDCK cells (Student’s t test). D) Western blots (left) of lysates of P+A+, P+A−, P−A+, and P−A− kidneys analyzed with AMPK, p-AMPK, p-ACC, and β-actin antibodies. Bar graph (right) shows the ratios of p-AMPK:AMPK. Means ± sem, n = 6. p-AMPK/AMPK: Fpkd1(1,20) = 0.24, P > 0.05; FAQP3(1,20) = 60.6, P < 0.01; FInteraction (1,20) = 4.03, P > 0.05 (2-way ANOVA). Bonferroni: AQP3 null kidneys (A−) vs. AQP3 expression kidneys (A+). **P < 0.01 [pkd1-expression kidneys (P+)], **P < 0.01 [pkd1-null kidneys (P−)].

