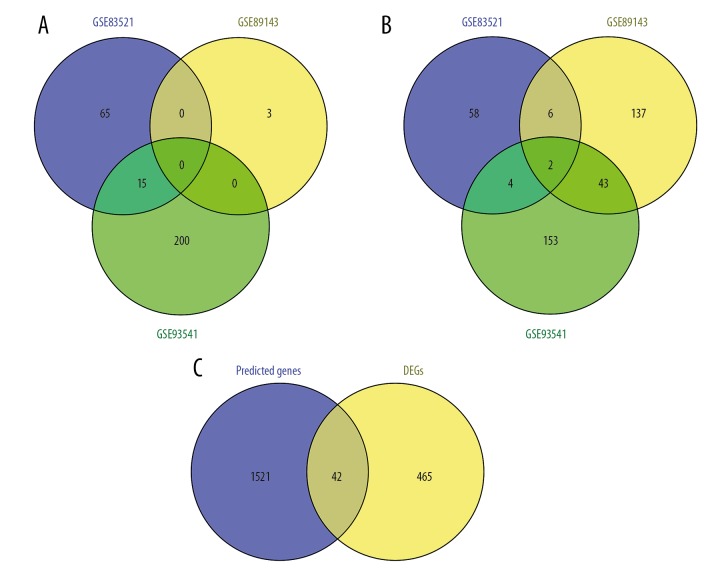
Figure 7.
Venn diagrams of (A) common upregulated and (B) common downregulated DE circRNAs in the 3 cohort profile datasets (GSE83521, GSE89143, and GSE93541). Different colored areas represent different datasets. The overlapping areas indicate common DE circRNAs. (C) Predicted target genes overlapping DEGs identified from the gene expression profiles. DE circRNAs, differentially expressed circRNAs; DEGs, differentially expressed genes.

