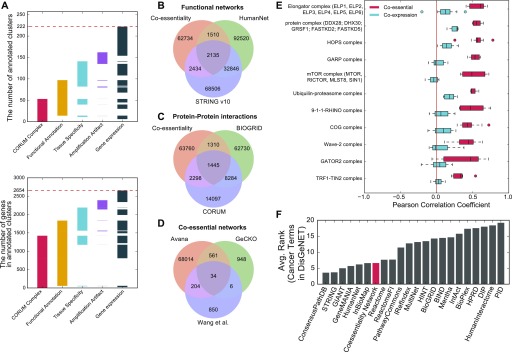
Figure 3. Beyond cancer: characterization of the coessentiality network.
(A) Number of clusters (top) and total genes in clusters (bottom) showing strong association with annotated protein complexes, biological function, tissue specificity, amplification-induced CRISPR artifacts, and differential expression of genes. (B–D) Comparing the Avana coessentiality network with other functional (B), protein–protein (C), and coessentiality networks (D) shows the unique information contained in our network. Each number indicates the number of interactions. (E) For some protein complexes, coessentiality is a better predictor of co-complex membership than co-expression. (F) The coessentiality network is a powerful predictor of cancer pathways (Huang et al, 2018) compared with other databases and networks (lower rank is better).

