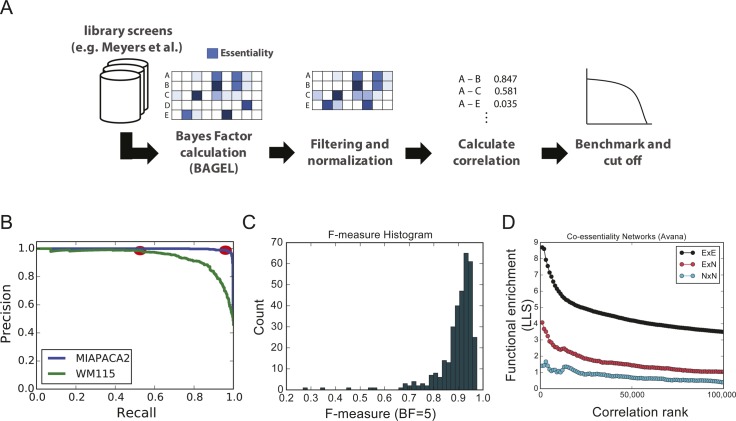
Figure S1. Making the network.
(A) Scoring and filtering data. For each data set, a Bayes factor profile is calculated using Bagel v2 and trained with CEGv2 essential genes and NEGv1 nonessential genes. Only protein-coding genes are considered. Poor-quality screens are discarded, remaining BF profiles are quantile-normalized, and a PCC is calculated for all gene pairs. (B) Recall-precision curves are calculated for each screen and the F-measure is calculated at the point on the curve where BF = 5. (C) The histogram of screen F-measures. Screens with F < 0.85 are discarded. (D) Functional enrichment score by gene type. E = essential gene, essential (BF > 5) in three or more screens after quantile normalization. Variation in fitness profiles of nonessential genes (NxE and NxN) is poorly predictive of shared gene function. Only correlations between genes essential in at least three cell lines were considered for the network. N, nonessential.

