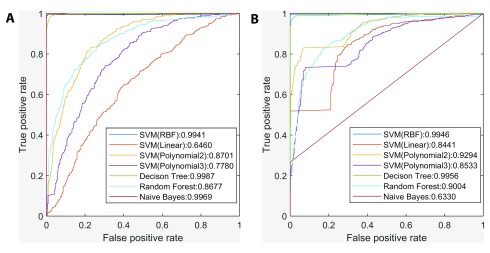
Figure 3. Comparison between the performance of different classifiers in prediction of genes with similar tissue-wide expression profiles to NR3C1.
( A) ROC curves and AUC of seven classifiers without intersecting promoters with DHSs. ( B) ROC curves and AUC of seven classifiers after intersecting promoters with DHSs. The Decision Tree classifier exhibited the largest AUC under both scenarios, and inclusion of DHS information significantly improved other classifiers’ AUC except for Naïve Bayes.

