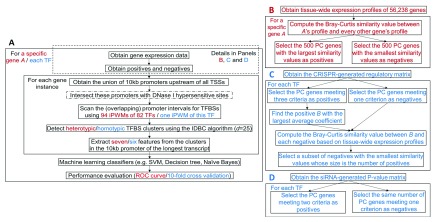
Figure 1. The general framework for predicting genes with similar tissue-wide expression profiles and TF targets.
Red and blue contents are respectively specific to prediction of genes with similar tissue-wide expression profiles and prediction of TF targets. ( A) An overview of the ML framework. The steps enclosed in the dashed rectangle vary across prediction of genes with similar tissue-wide expression profiles and TF targets. The step with a dash-dotted border that intersects promoters with DHSs is a variant of the primary approach. In the IDBC algorithm (Additional file 1 22), the parameter I is the minimum threshold on the total information contents of TFBS clusters. In prediction of genes with similar tissue-wide expression profiles, the minimum value was 939, which was the sum of mean information contents ( R sequence values) of all 94 iPWMs; in prediction of direct targets, this value was the R sequence value of the single iPWM used to detect TFBSs. The parameter d is the radius of initial clusters in base pairs, whose value, 25, was determined empirically. The seven ML features derived from TFBS clusters are described in the Methods section. The performance of seven different classifiers was evaluated with ROC curves and 10-fold cross validation (Additional file 1 22). ( B) Obtaining the positives and negatives for identifying genes with similar tissue-wide expression profiles to a given gene (Additional file 2 22). ( C) Obtaining the positives and negatives for predicting target genes of seven TFs using the CRISPR-generated perturbation data in K562 cells (Additional file 3 22). ( D) Obtaining the positives and negatives for predicting target genes of 11 TFs using the siRNA-generated knockdown data in GM19238 cells (Additional file 4 22).

