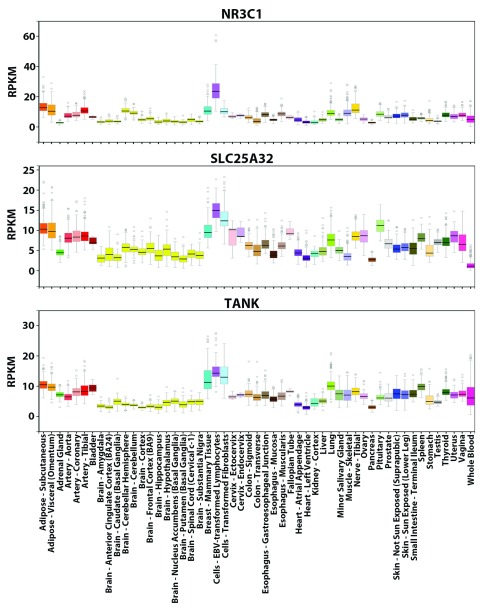
Figure 2. GTEx tissue-wide expression profiles of NR3C1, SLC25A32 and TANK.
Visualization of the expression values (in RPKM) of these genes across 53 tissues from GTEx. For each gene, the colored rectangle belonging to each tissue indicates the valid RPKM of all samples in the tissue, the black horizontal bar in the rectangle indicates the median RPKM, the hollow circles indicate the RPKM of the samples considered as outliers, and the grey vertical bar indicates the sampling error. A comparison of the panels shows that the overall expression patterns of the three genes across the 53 tissues resemble each other (e.g. all three genes exhibit the highest expression levels in lymphocytes and the lowest levels in brain tissues).

