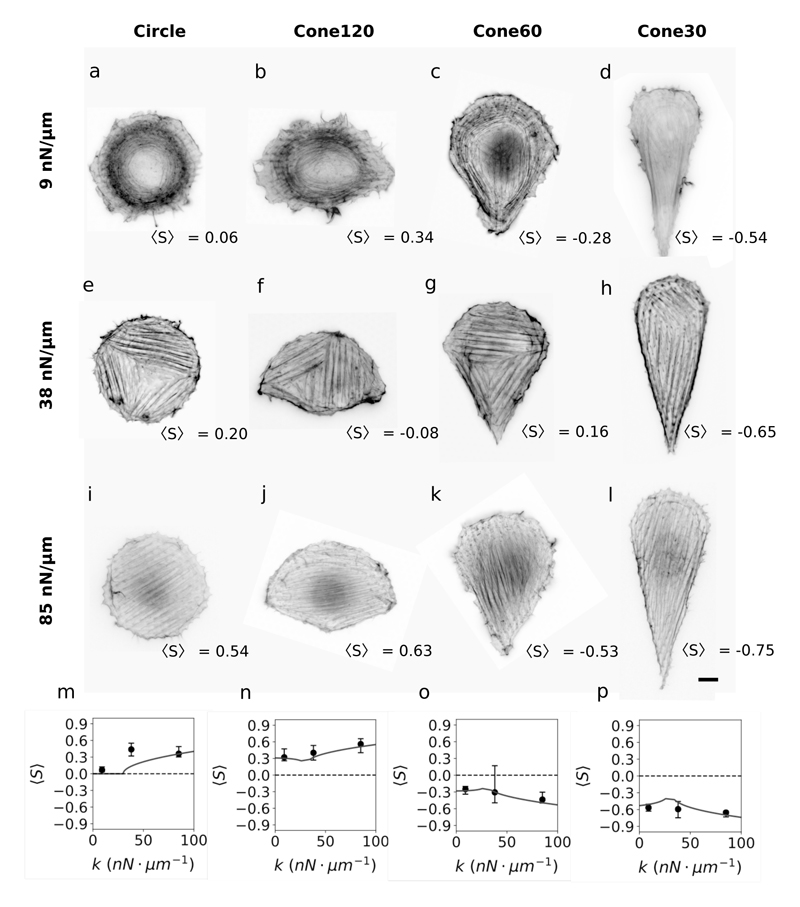
Fig. 3. Actin cytoskeleton organization depends on ECM stiffness and cell shape.
(a-l) Representative fluorescence images of actin filaments inside cells of different shapes and adhered on micropillar substrates with stiffness as indicated. Scale bar, 10 μm. (m-p) Order parameter, 〈S〉, of actin cytoskeleton for cells adhered on different substrate stiffness (9, 38 and 85 nN μm−1) and in different shapes (circle, cone120, cone60, and cone30 respectively). Each data point represents median values obtained from 24-86 cells. Error bar ends represent first and third quartiles of the data. Theoretical fits were obtained from Eq. 7 using k* = 30 nN μm−1 [13], m was calculated as 0, 0.17, -0.14 and -0.62 using Eqs. 5 and 6. were the only parameters required to fit all experimental data (R2 = 0.73); was only used to remove divergence at k = k*. The 95% confidence intervals for the degree of influence of stiffness a and for the degree of influence of shape b are 1.66 < a < 2.97 and 0.42 < b < 0.72.

