
Figure 4. Network Maps.
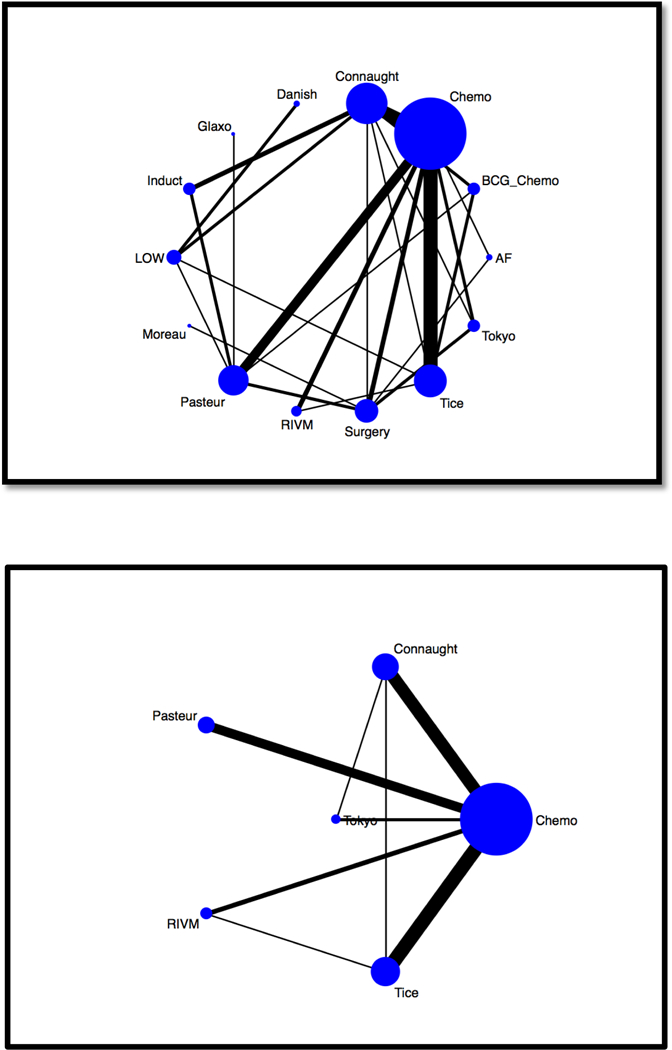
Network maps were created for bladder cancer recurrence based upon (a) all possible comparators and (b) chemotherapy as common comparator. The size of the nodes (blue circles) corresponds to the number of trials using each treatment. Each treatment is linked with a black line, the thickness of which corresponds to the number of trials that evaluated the treatments. Induct = BCG Induction only. LOW = low-dose BCG. Surgery = TURBT. AF = Armand-Frappier. BCG-Chemo = Combination BCG and chemotherapy. Chemo = chemotherapy.