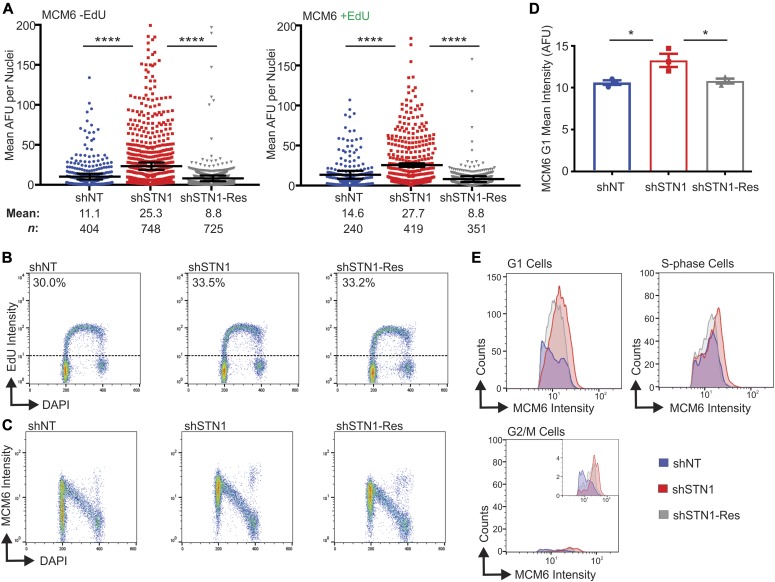
Figure 2. Chromatin-bound MCM increases in both G1 and S-phase with STN1 depletion.
The indicated cell lines were labeled with EdU, pre-extracted, and MCM6 detected. (A) Dot plots of mean MCM6 intensity. S-phase cells are indicated as +EdU. Black line and numbers below the graph indicate the mean AFU. Error bars indicate the ±SEM of three independent biological experiments. n indicates the number of total nuclei scored. (B–E) Flow cytometry data are representative of four independent biological experiments. (B) DNA content (DAPI) versus EdU signal intensity. Numbers above the dashed line represents the percentage of EdU+ cells. (C) DNA content versus MCM6 intensity. (D) Graph of the mean intensity of G1 MCM6-positive cells (see the Materials and Methods section and Fig S2 for gating). (E) Histograms showing the distribution of MCM signal intensity for G1, S-phase, or G2/M cells (see the Materials and Methods section). P-values were calculated by an unpaired, two-tailed Mann–Whitney test in (A) and t test in (D) (****P ≤ 0.0001, *P ≤ 0.05).

