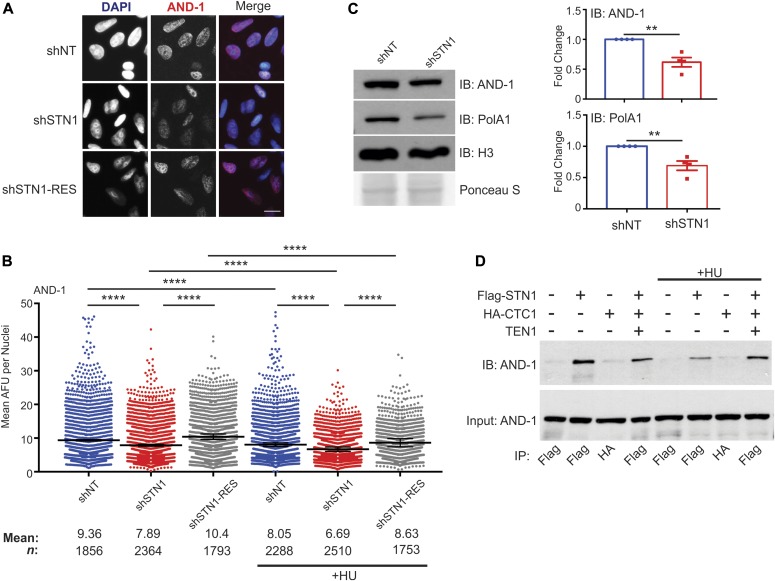
Figure 6. CST is required for AND-1 and pol α chromatin association.
(A) Representative images of pre-extracted HeLa cells used to measure chromatin-associated AND-1. DAPI: blue, AND-1: red. Scale bar = 12.5 μm. (B) Dot plots of mean AND-1 intensity per nuclei in AFU for each cell line, as indicated. Black line and numbers below the graph indicate the mean AFU. Error bars indicate the ±SEM of three independent biological experiments. (C) Western blot analysis showing chromatin fractions from HCT116 cells. Ponceau S and histone H3 were used as loading controls. AND-1 and pol α levels were normalized to H3 levels and then normalized to the shNT control. (D) Co-IP was performed with Flag or HA antibody in cell lysates from HEK 293T cells, as indicated. 5% input was loaded as a control. For +HU samples in (B) and (D), HU was added 2 h before collection. Data are representative of three independent biological experiments. n indicates the number of total nuclei scored. P-values were calculated by an unpaired, two-tailed Mann–Whitney test in (B) and t test in (C) (****P ≤ 0.0001, **P ≤ 0.01).

