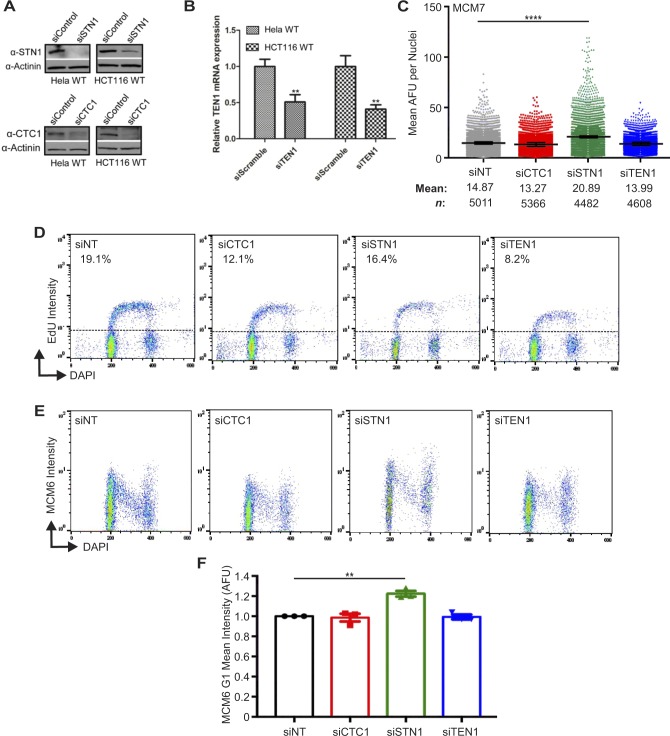
Figure S4. Chromatin-bound MCM levels following siRNA knockdown of CST subunits.
(A) Western blots of siSTN1 or siCTC1 knockdown efficiency in Hela and HCT116 cell lines. Actinin was used as a loading control. (B) TEN1 mRNA levels detected by RT-qPCR amplification from TEN1 siRNA-treated HeLa and HCT116 cells. (C) IF was performed for MCM7 in pre-extracted HeLa cells. Dot plots of mean MCM7 intensity per nuclei in indicated cell lines. Black line and numbers below the graph indicate the mean AFU. Error bars represent the ±SEM of three independent experiments. n indicates the number of total nuclei scored. (D–F) HCT116 cells were treated with siRNA, as indicated, labeled with EdU, pre-extracted, fixed, and flow cytometry performed to detect MCM6, EdU, and DAPI. Data are representative of three independent biological experiments. (D) DNA content (DAPI) versus EdU signal intensity. (E) DNA content versus MCM6 intensity. (F) Graph of the intensity of G1 MCM6 positive cells. Data were normalized to the siNT control. P-values were calculated by an unpaired, two-tailed Mann–Whitney (C) or an unpaired, two-tailed t test (B, F) (****P ≤ 0.0001, **P ≤ 0.01).

