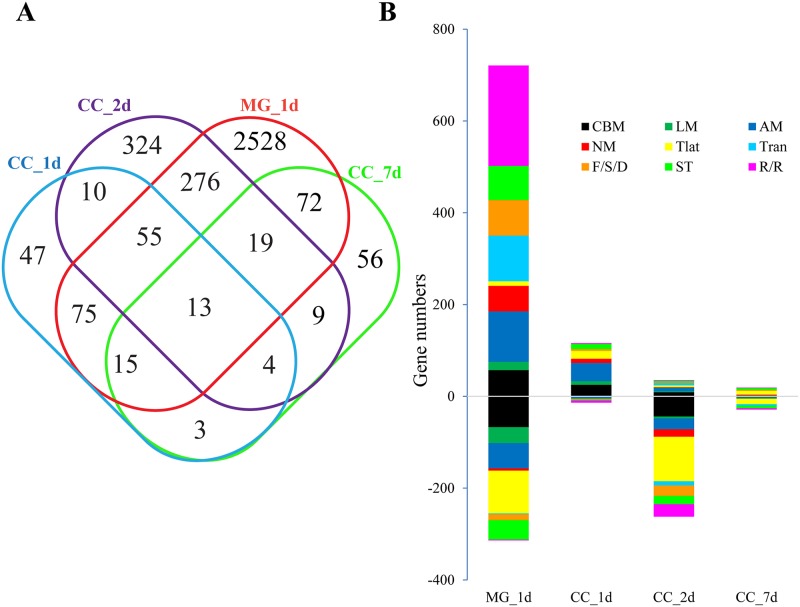
Fig 1. Transcriptional regulation of gene cohorts in response to dengue virus infection.
A, Venn diagram representing unique and shared transcriptome regulation in DENV-infected mosquito tissues. Hierarchical clustering analysis of DEGs in the midgut and carcass of Ae. aegypti infected by DENV at 1, 2 and 7 d.p.i., respectively. All genes with p values less than 0.05 under at least two experimental conditions were regarded as differentially expressed. The DEGs common to both mosquito tissues were used for Venn diagram. CC_1d, carcass 1 d.p.i.; CC_2d, carcass 2 d.p.i.; CC_7d, carcass 7 d.p.i.; MG_1d, midgut 1 d.p.i. B, Functional classification of DEGs in the DENV-infected mosquito midgut and carcass. CBM, carbohydrate metabolism; LM, lipid metabolism; NM, nucleotide metabolism; AM, amino acid metabolism; Tran, transcription; Tlat, translation; F/S/D, folding, sorting and degradation; R/R, replication and repair; ST, signal transduction.

